Of course we cannot always share details about our work with customers, but nevertheless it is nice to show our technical achievements and share some of our implemented solutions.
For our central Checkpoint VSX firewalls, we created a live dashboard with Grafana. It uses InfluxDB as datasource, data is fed from Icinga 2 by using the check_nwc_health plugin. Grafana itself runs on two servers for redundancy. The http traffic loading the dashboards in a browser goes through a Nginx reverse proxy and a HAProxy load balancer. So far so good.
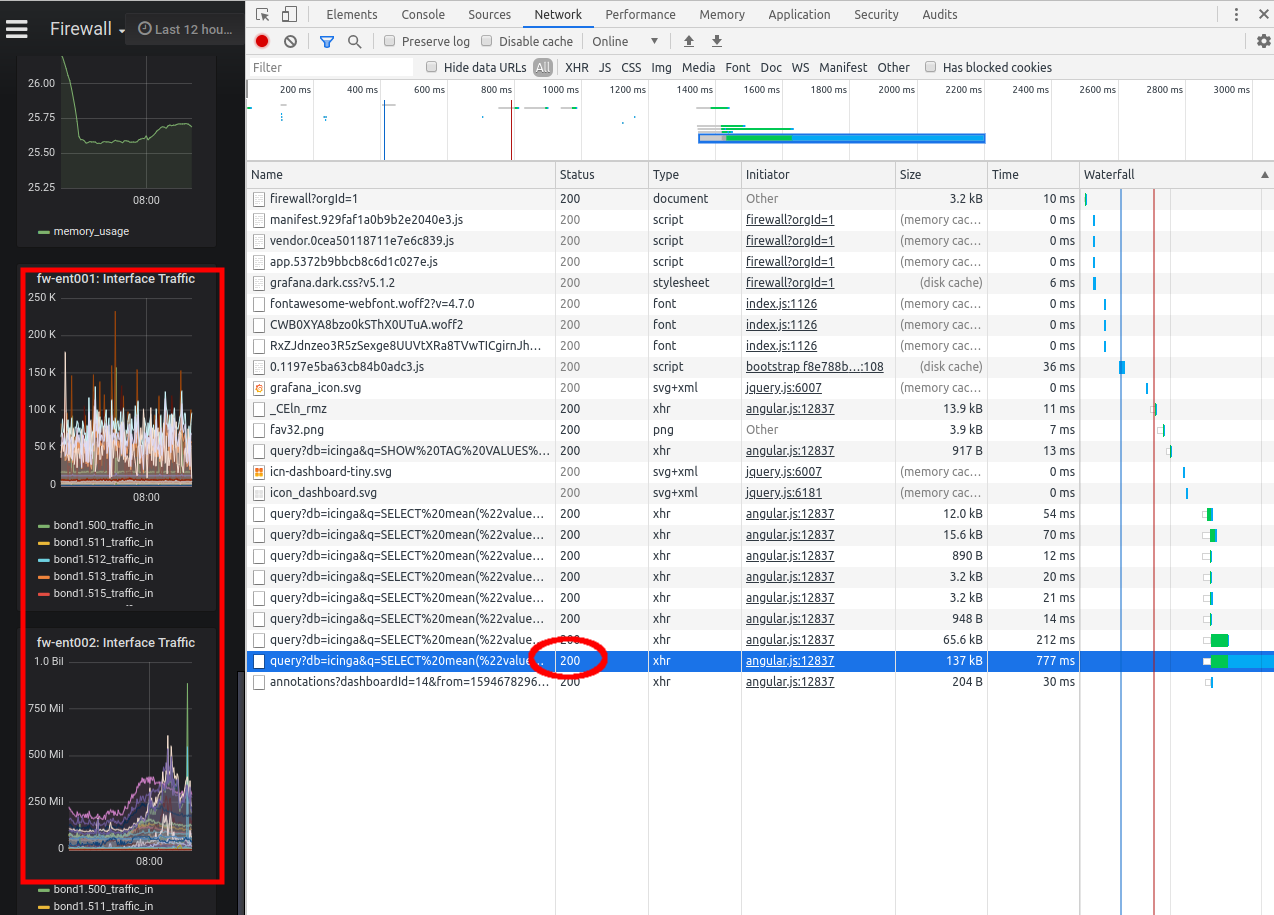
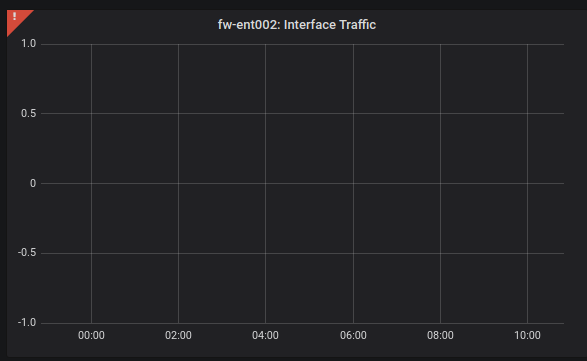
However since we added another virtual firewall instance (vsenv), the number of monitored interfaces increased and since then the dashboard was not able to show the interface traffic graph anymore:
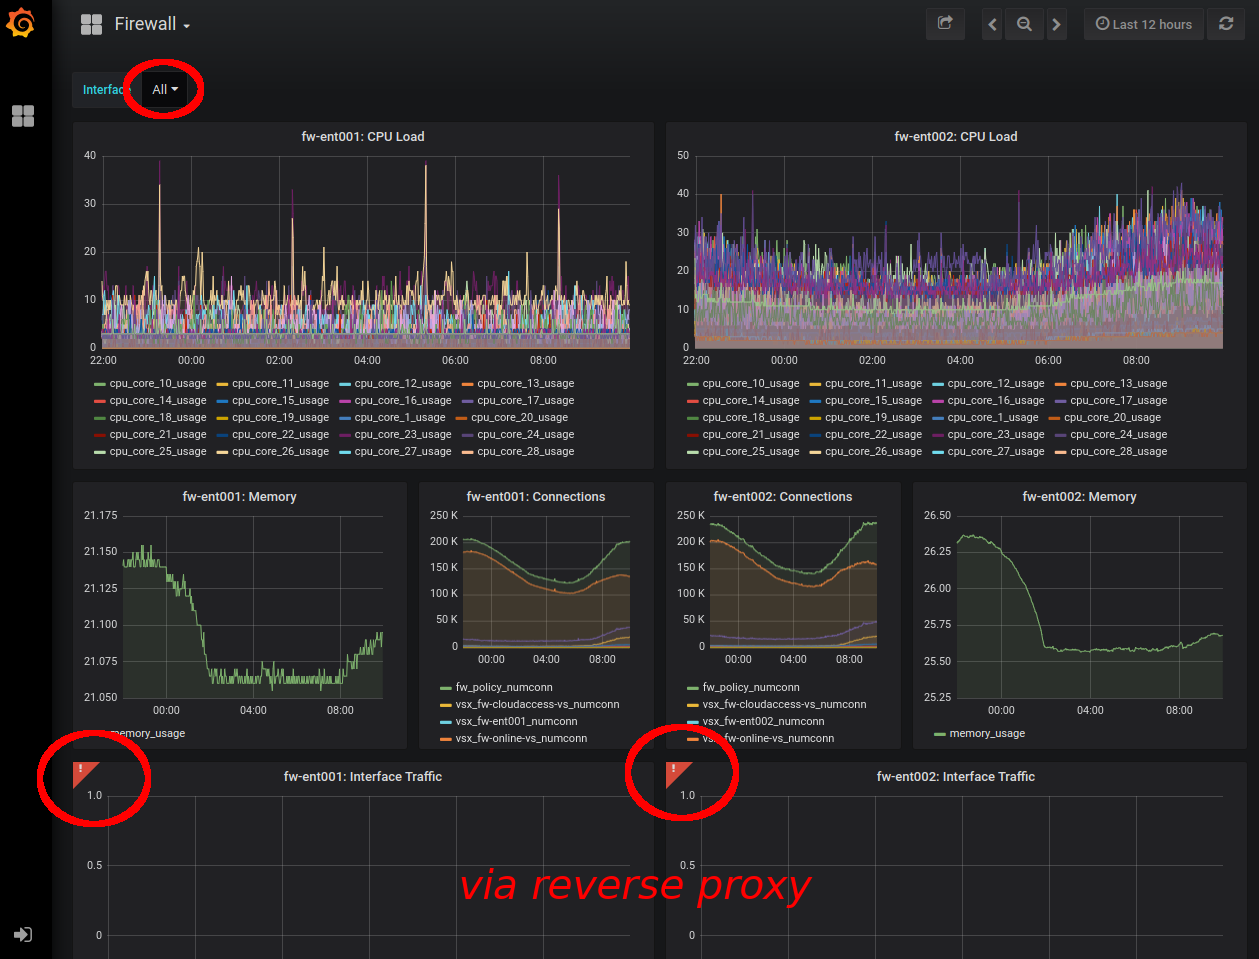
At first a problem in the Influx query was suspected but when Grafana was directly accessed to modify the dashboard, the interface traffic graphs were showing up correctly:
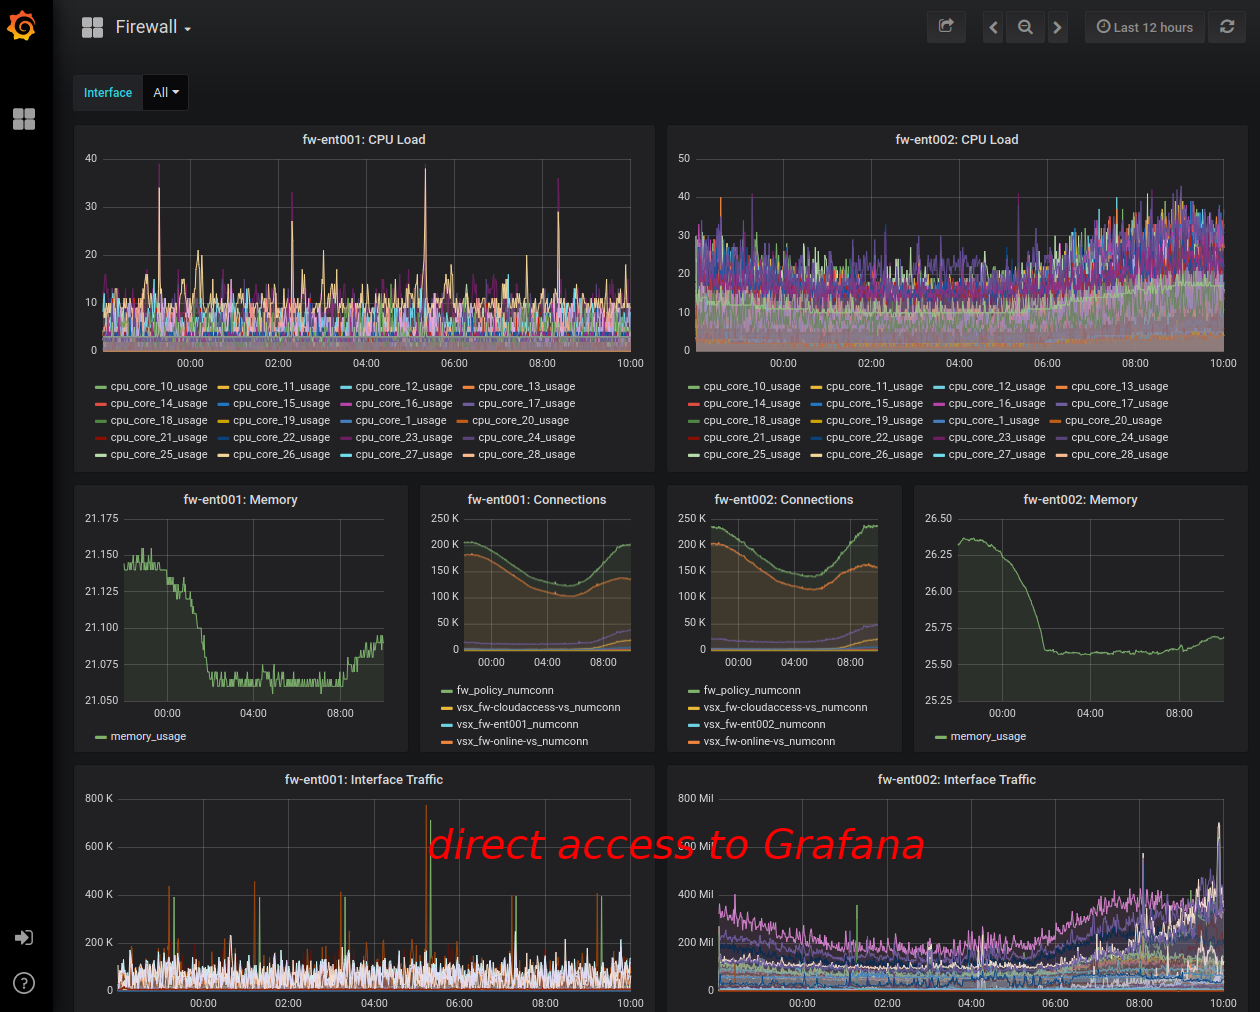
The difference: The (official) Grafana access through reverse proxy doesn't show the interface traffic graph - but the graph is showing up correctly with direct Grafana access (without reverse proxy).
To find out more, a click on the "red warning" icon opens the Grafana inspector. In the "Response" tab, the error 414 Request-URI Too Large can be seen:
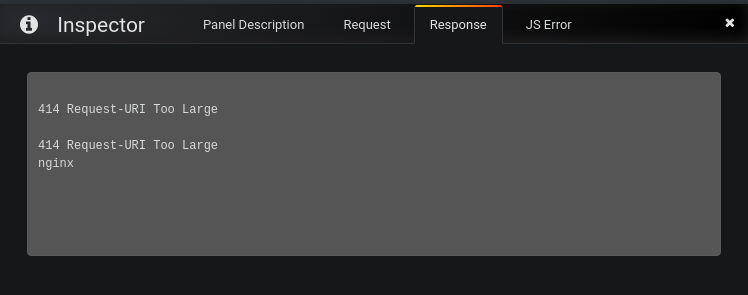
Such an error is typically thrown by a Nginx server when the HTTP request (from the client) sends a header size which is too large for the defined limit. The Nginx documentation of large_client_header_buffers states:
Sets the maximum number and size of buffers used for reading large client request header. A request line cannot exceed the size of one buffer, or the 414 (Request-URI Too Large) error is returned to the client.
The Nginx default for this parameter is 8KB. This value needs to be increased in this case due to the high number of interfaces which all happen to be part of the HTTP request.
Note: In an older article the client header sizes were analyzed and the defaults compared on different web servers. See Debugging a HTTP 400 Bad Request error in Nginx leads to too large headers for more information.
By looking at the browser console, it doesn't take eyes of an eagle to see the huge header request (remember: GET /path is part of the http request header):
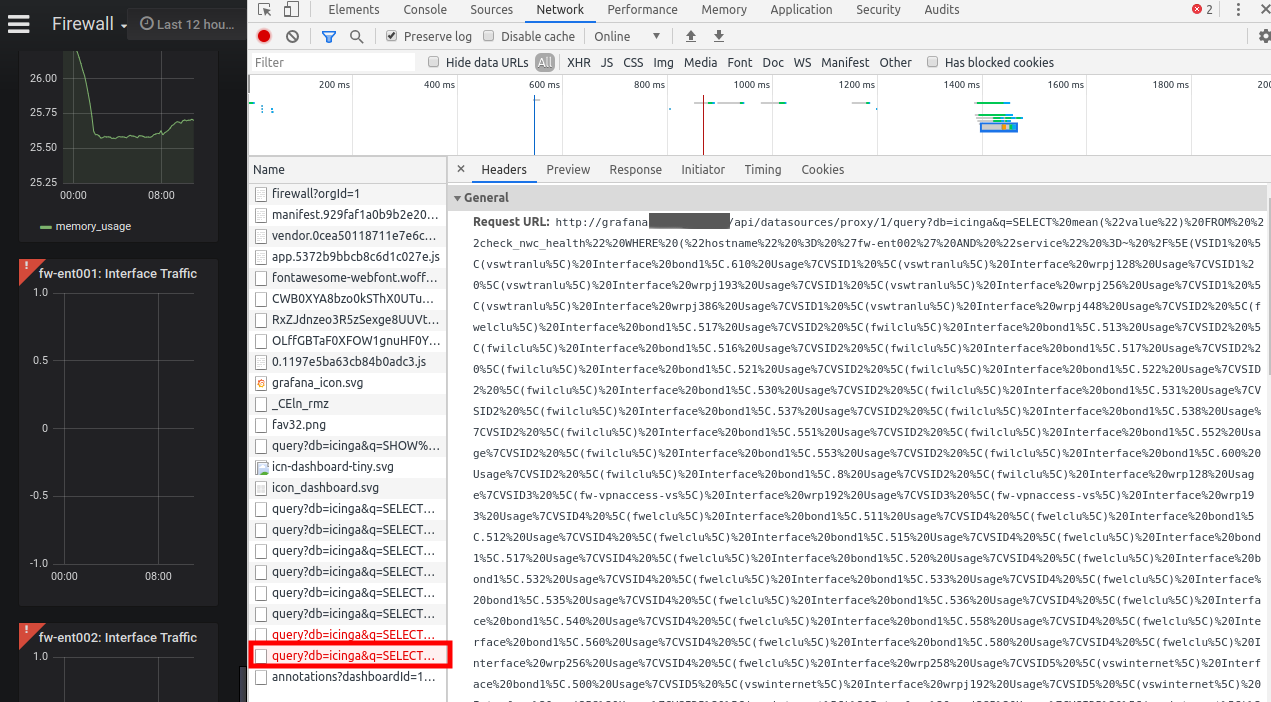
By copying the request headers (right click on the request -> Copy -> Copy Request Headers), the same request can be adjusted to be sent with curl. curl can then be used to display the size of the request:
$ curl "http://grafana.example.com/api/datasources/proxy/1/query?[...]fill(previous)&epoch=ms" -H "Host: grafana.example.com" -H "Connection: keep-alive" -H "Accept: application/json, text/plain, */*" -H "User-Agent: Mozilla/5.0 (X11; Linux x86_64) AppleWebKit/537.36 (KHTML, like Gecko) Chrome/81.0.4044.129 Safari/537.36" -H "X-Grafana-Org-Id: 1" -H "Referer: http://grafana.example.com/d/_CEln_rmz/firewall?orgId=1" -H "Accept-Encoding: gzip, deflate" -H "Accept-Language: en-US,en;q=0.9" -H "Cookie: grafana_sess=f6647e20ef082863" -w \%{size_request} -o /dev/null -s
10285
According to curl, the request has a size of 10285 Bytes (= 10.04 KB) which is higher than the Nginx default of 8KB (defined in large_client_header_buffers setting).
In Nginx, the request can be watched by enabling debug logging:
2020/07/14 11:59:53 [debug] 23749#23749: *2058212 accept: 10.130.136.195:33258 fd:4
2020/07/14 11:59:53 [debug] 23749#23749: *2058212 event timer add: 4: 60000:19892540945
2020/07/14 11:59:53 [debug] 23749#23749: *2058212 reusable connection: 1
2020/07/14 11:59:53 [debug] 23749#23749: *2058212 epoll add event: fd:4 op:1 ev:80002001
2020/07/14 11:59:53 [debug] 23749#23749: *2058212 http wait request handler
2020/07/14 11:59:53 [debug] 23749#23749: *2058212 malloc: 000055CE48ECA1F0:1024
2020/07/14 11:59:53 [debug] 23749#23749: *2058212 recv: eof:0, avail:1
2020/07/14 11:59:53 [debug] 23749#23749: *2058212 recv: fd:4 1024 of 1024
2020/07/14 11:59:53 [debug] 23749#23749: *2058212 reusable connection: 0
2020/07/14 11:59:53 [debug] 23749#23749: *2058212 posix_memalign: 000055CE48EFC690:4096 @16
2020/07/14 11:59:53 [debug] 23749#23749: *2058212 http process request line
2020/07/14 11:59:53 [debug] 23749#23749: *2058212 http alloc large header buffer
2020/07/14 11:59:53 [debug] 23749#23749: *2058212 malloc: 000055CE48F29C40:8192
2020/07/14 11:59:53 [debug] 23749#23749: *2058212 http large header alloc: 000055CE48F29C40 8192
2020/07/14 11:59:53 [debug] 23749#23749: *2058212 http large header copy: 1024
2020/07/14 11:59:53 [debug] 23749#23749: *2058212 recv: eof:0, avail:1
2020/07/14 11:59:53 [debug] 23749#23749: *2058212 recv: fd:4 424 of 7168
2020/07/14 11:59:53 [debug] 23749#23749: *2058212 http process request line
2020/07/14 11:59:53 [debug] 23749#23749: *2058212 recv: eof:0, avail:1
2020/07/14 11:59:53 [debug] 23749#23749: *2058212 recv: fd:4 6744 of 6744
2020/07/14 11:59:53 [debug] 23749#23749: *2058212 http alloc large header buffer
2020/07/14 11:59:53 [info] 23749#23749: *2058212 client sent too long URI while reading client request line, client: 10.130.136.195, server: , request: "GET /api/datasources/proxy/1/query?db=icinga&q=SELECT%20mean(%22value%22)%20FROM%20%22check_nwc_health%22%20WHERE%20(%22hostname%22%20%3D%20%27fw-ent002%27%20AND%20%22service%22%20%3D~%20%2F%5E(VSID1%20%5C(vswtranlu%5C)%20Interface%20bond1%5C.610%20Usage%7CVSID1%20%5C(vswtranlu%5C)%20Interface%20wrpj128%20Usage%7CVSID1%20%5C(vswtranlu%5C)%20Interface%20wrpj193%20Usage%7CVSID1%20%5C(vswtranlu%5C)%20Interface%20wrpj256%20Usage%7CVSID1%20%5C(vswtranlu%5C)%20Interface%20wrpj386%20Usage%7CVSID1%20%5C(vswtranlu%5C)%20Interface%20wrpj448%20Usage%7CVSID2%20%5C(fwelclu%5C)%20Interface%20bond1%5C.517%20Usage%7CVSID2%20%5C(fwilclu%5C)%20Interface%20bond1%5C.513%20Usage%7CVSID2%20%5C(fwilclu%5C)%20Interface%20bond1%5C.516%20Usage%7CVSID2%20%5C(fwilclu%5C)%20Interface%20bond1%5C.517%20Usage%7CVSID2%20%5C(fwilclu%5C)%20Interface%20bond1%5C.521%20Usage%7CVSID2%20%5C(fwilclu%5C)%20Interface%20bond1%5C.522%20Usage%7CVSID2%20%5C(fwilclu%5C)%20Interface%20bond1%5C.530%20Usage%7CVSID2%20%5C(fwilclu%5C)%20Interface%20bond1%5C.531%20Usage%7CVSID2%20%5C(fwilclu%5C)%20Interface%20bond1%5C.537%20Usage%7CVSID2%20%5C(fwilclu%5C)%20Interface%20bond1%5C.538%20Usage%7CVSID2%20%5C(fwilclu%5C)%20Interface%20bond1%5C.551%20Usage%7CVSID2%20%5C(fwilclu%5C)%20Interface%20bond1%5C.552%20Usage%7CVSID2%20%5C(fwilclu%5C)%20Interface%20bond1%5C.553%20Usage%7CVSID2%20%5C(fwilclu%5C)%20Interface%20bond1%5C.600%20Usage%7CVSID2%20%5C(fwilclu%5C)%20Interface%20bond1%5C.8%20Usage%7CVSID2%20%5C(fwilclu%5C)%20Interface%20wrp128%20Usage%7CVSID3%20%5C(fw-vpnaccess-vs%5C)%20Interface%20wrp192%20Usage%7CVSID3%20%5C(fw-vpnaccess-vs%5C)%20Interface%20wrp193%20Usage%7CVSID4%20%5C(fwelclu%5C)%20Interface%20bond1%5C.511%20Usage%7CVSID4%20%5C(fwelclu%5C)%20Interface%20bond1%5C.512%20Usage%7CVSID4%20%5C(fwelclu%5C)%20Interface%20bond1%5C.515%20Usage%7CVSID4%20%5C(fwelclu%5C)%20Interface%20bond1%5C.517%20Usage%7CVSID4%20%
2020/07/14 11:59:53 [debug] 23749#23749: *2058212 http finalize request: 414, "?" a:1, c:1
2020/07/14 11:59:53 [debug] 23749#23749: *2058212 event timer del: 4: 19892540945
2020/07/14 11:59:53 [debug] 23749#23749: *2058212 http special response: 414, "?"
2020/07/14 11:59:53 [debug] 23749#23749: *2058212 http set discard body
2020/07/14 11:59:53 [debug] 23749#23749: *2058212 HTTP/1.1 414 Request-URI Too Large
Server: nginx
Date: Tue, 14 Jul 2020 09:59:53 GMT
Content-Type: text/html
Content-Length: 186
Connection: close
The large_client_header_buffers setting can be defined in either http or server context. As Grafana uses a dedicated domain in this particular environment, the server context was adjusted:
server {
server_name grafana.example.com;
access_log /var/log/nginx/grafana.access.log;
error_log /var/log/nginx/grafana.error.log;
# Increase large http headers
large_client_header_buffers 4 16k;
location / {
include /etc/nginx/proxy.conf;
proxy_pass http://127.0.0.1:5001;
}
}
The default header size limit in HAProxy (next hop, here in the config showing up as http://127.0.0.1:5001) is 16K as well (see again Debugging a HTTP 400 Bad Request error in Nginx leads to too large headers for more information), so the original request coming in at 10K should work. But nope, the graph still shows the same error:
Interestingly the same error 414 is still returned.
The large_client_header_buffers had to be defined within the http context (in /etc/nginx/nginx.conf):
http {
##
# Basic Settings
##
sendfile on;
tcp_nopush on;
tcp_nodelay on;
keepalive_timeout 65;
types_hash_max_size 2048;
server_tokens off;
server_names_hash_bucket_size 128;
# server_name_in_redirect off;
include /etc/nginx/mime.types;
default_type application/octet-stream;
large_client_header_buffers 4 16k;
##
# Logging Settings
##
[...]
Only after this modification and a Nginx reload, the simulated request with curl seems to work (no error 414 shown anymore):
$ curl "http://grafana.example.com/api/datasources/proxy/1/query?[...]fill(previous)&epoch=ms" -H "Host: grafana.nzzmg.local" -H "Connection: keep-alive" -H "Accept: application/json, text/plain, */*" -H "User-Agent: Mozilla/5.0 (X11; Linux x86_64) AppleWebKit/537.36 (KHTML, like Gecko) Chrome/81.0.4044.129 Safari/537.36" -H "X-Grafana-Org-Id: 1" -H "Referer: http://grafana.nzzmg.local/d/_CEln_rmz/firewall?orgId=1" -H "Accept-Encoding: gzip, deflate" -H "Accept-Language: en-US,en;q=0.9" -H "Cookie: grafana_sess=f6647e20ef082863"
Warning: Binary output can mess up your terminal. Use "--output -" to tell
Warning: curl to output it to your terminal anyway, or consider "--output
Warning:
What about the graph in Grafana's dashboard? And indeed, finally the traffic graphs were showing up and the browser console confirmed the request returned a status 200: