
Because our managed Monitoring as a Service won't leave you in the dark.
You are running your own server or multiple servers. Maybe you do have an external check on your website active. Good, but do you have in-depth monitoring active? Are your important services and processes covered? What about services with listening ports? Is the background API working? Did the database backup work? Is the server hardware healthy?
These are questions which often don't come up in terms of monitoring. Luckily we are monitoring experts with over 15 years of hands-on monitoring experience and can help you find the hidden and missing parts of systems monitoring.

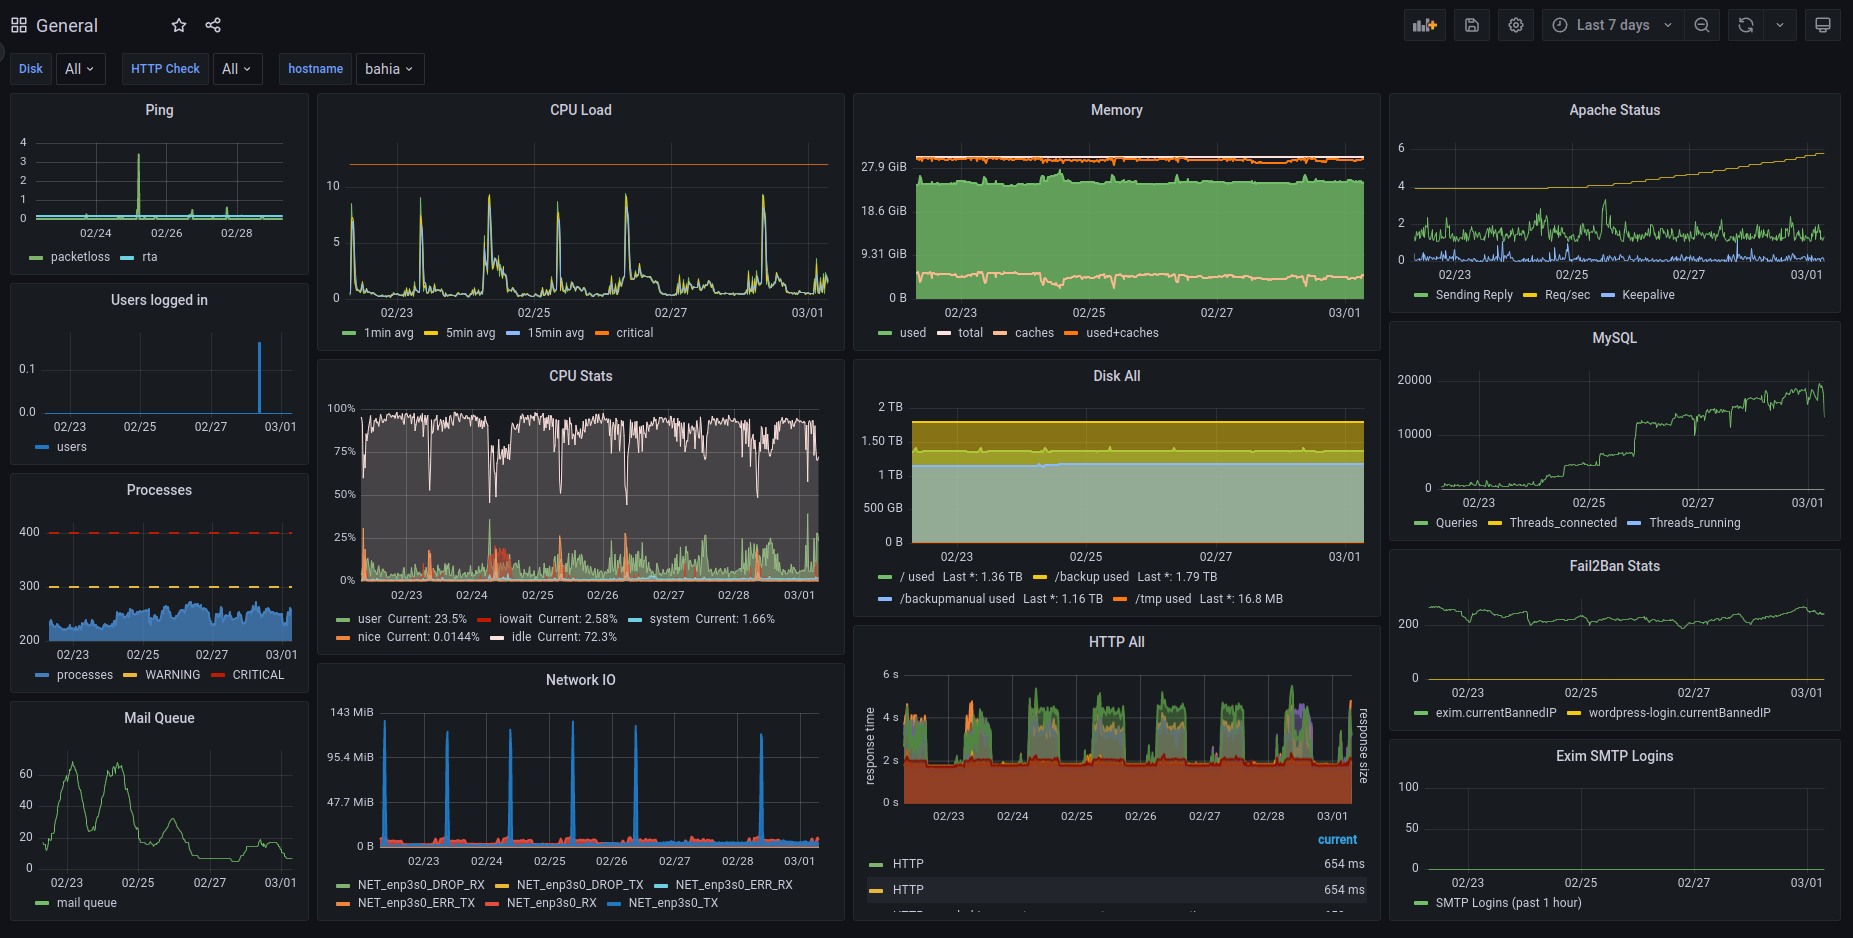
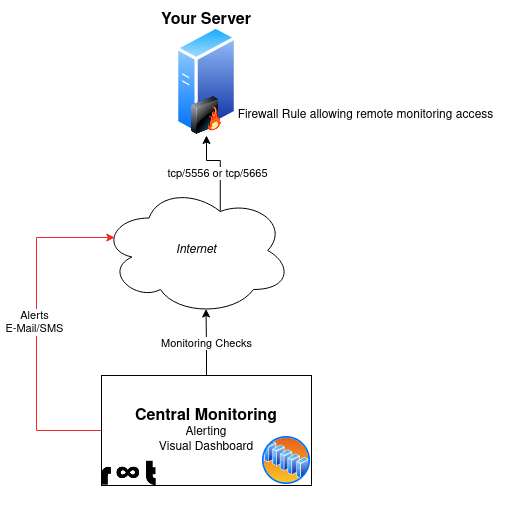
The monitoring process is simple: Our centralized monitoring connects to your server(s) remotely and executes checks. The check results are fed into the central monitoring and send alerts if a checked service doesn't respond or if a critical threshold is reached. Most of these checks create so-called performance data. This data is fed into a timeseries database from which statistical graphs are created. A personally customized dashboard of your server presents this data to you.
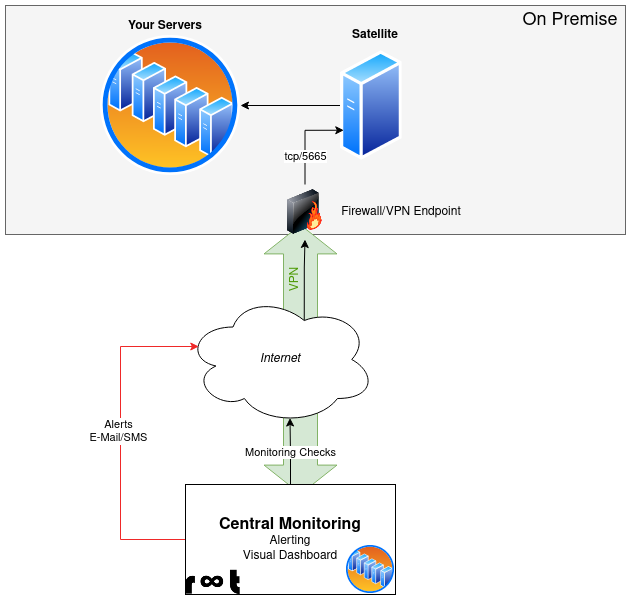
For a single server or just a few servers with public IP addresses our central monitoring connects directly through the Internet using IP restricted firewall rules. For a larger number of servers or internal (backend) servers, the connection is established through a secure VPN tunnel. A mix of different ways of secure communication is possible (yes, we're pretty flexible).
You prefer to run a dedicated monitoring system in your own network or on premise? No problem, we can build and manage the whole monitoring stack in your own environment on your servers, too.

At Kühnis Optik Gossau we use a central server for our backups. With the monitoring services from Infiniroot we know this server and the data is constantly being monitored and we are pro-actively informed if something is wrong.

Veeps Hosting regularly engages Infiniroot to assist with Icinga monitoring and other Ubuntu Linux related issues. Without doubt these guys know a lot! They can build custom modules fast and make sure you know when something is broken. Top that off with their ability to solve problems fast and this is a great service offering.

We run our own server infrastructure on-premise, which includes VMware hypervisors, Windows domain controllers and backup servers. All these servers are monitored by Infiniroot where we appreciate the competent and reliable service and their fair prices.
Let's suppose you run a web application and you currently use a basic HTTP request to check whether your website is working or not. But is it really enough? Maybe your web application uses multiple databases in the background. Are they working? Are they performing? What about file systems? If the capacities are used, your HTTP check might still return OK but orders on an online shop could fail. Are there other dependencies, for example external gateway providers, which need to be verified? Maybe your application writes errors into a log file and nobody is aware of it?
A proper monitoring can't be done with a simple HTTP check. It can become quite complex and that's why our vast monitoring experience helps you monitor your servers and applications in detail. The following list is a non conclusive list of services we are monitoring now or we have monitored in the past. And if the product/service you are using is not on the list, we can still write custom checks (monitoring plugins) for it.
As the number of your own servers might increase or decrease, so will the number of monitored servers and services. To be flexible, we offer multiple monitoring packages, based on the number of servers (clients) to be monitored.
| Monitoring package | Light | Basic | Advanced | Ultimate |
|---|---|---|---|---|
| No. of monitored servers ¹ | 1-2 | 3-10 | 11-50 | >50 |
| No. of monitored services ² | unlimited | unlimited | unlimited | unlimited |
| No. of monitoring users | up to 2 | up to 3 | up to 5 | up to 10 |
| Alerts (E-Mail) | ||||
| Alerts (SMS) | (Host alerts only) | (Host alerts only) | (Host and selected services) | (Host and selected services) |
| Custom observability dashboard | ||||
| Included support/month ³ | 1h | 2h | 4h | 6h |
| Estimated (one-time) setup fee | CHF 200 | CHF 400 | CHF 750 | based on effort |
| Recurring monthly fees | CHF 15 | CHF 40 | CHF 99 | based on sizing |
All prices are in Swiss Francs (CHF) excluding VAT, applicable for customers in Switzerland and Liechtenstein.
¹ Number of servers/clients being monitored and defined as host objects in monitoring.
² Only services running locally on the server. External service checks need to be defined in a separate host object.
³ Number of hours of support per month (non-cumulative). Included support contains adjustment of thresholds and adding additional monitoring objects and checks. Support requests exceeding the defined included support hours are invoiced separately by applying our hourly rate on the efforts.
Please use our contact form to order our managed monitoring service. If possible, already mention the number of servers and their specifics in the description.
For example:
For complex environments with more than a handful servers, we will initiate a kick-off call with you.