
Of course we cannot always share details about our work with customers, but nevertheless it is nice to show our technical achievements and share some of our implemented solutions.
Monitoring remote hosts with Icinga can be done with different remote agents. The recommended and default agent is the "Icinga 2 Agent". A remote host is defined as an "endpoint" and is part of a "zone" within the Icinga 2 setup. The Icinga master connects to the zones by securely (encrypted communication using client certificates) connecting to the endpoint(s) of a zone.
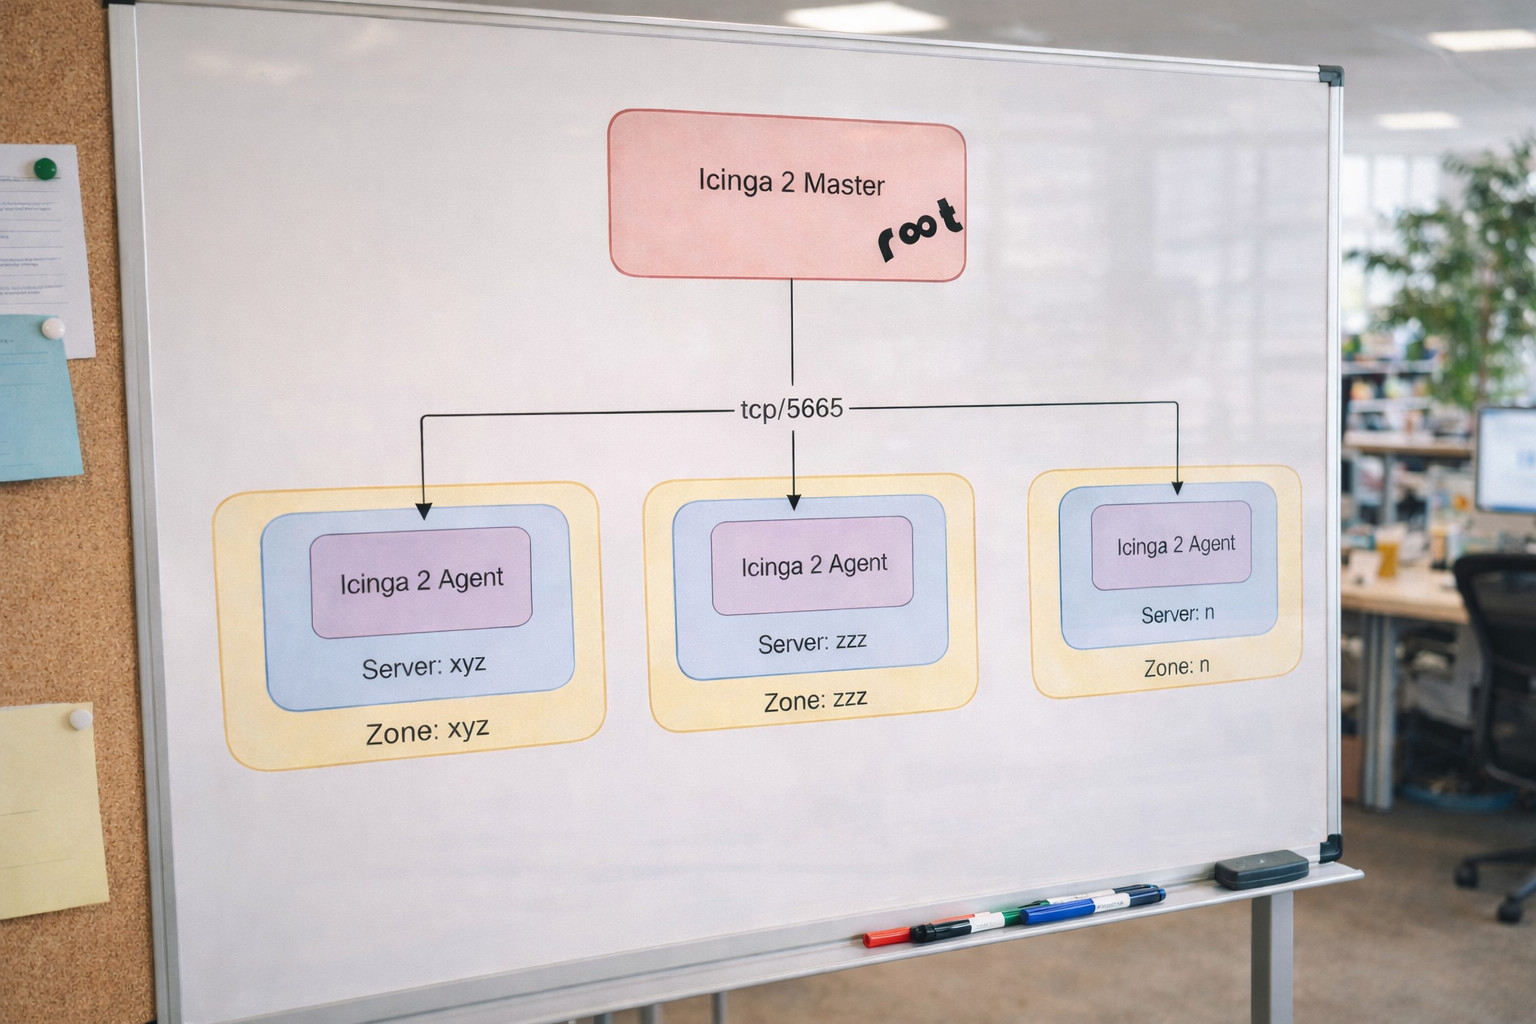
In a setup, where you use Icinga 2 Agent for all or almost all your remote server monitoring, the remote server (endpoint) often is in itself its own zone.
All these remote servers running the Icinga 2 Agent are now in your Icinga monitoring. So far, so good. But how do you monitor them?
Sure, you have the Icinga 2 Agent running and it checks local stuff, such as CPU usage, File Systems usage, etc. But what happens, if your Icinga 2 Agent is down or is not responding (seen a lot during OOM situations)?
The service checks, supposedly executed locally on the remote server using Icinga 2 Agent, change into an UNKNOWN state.
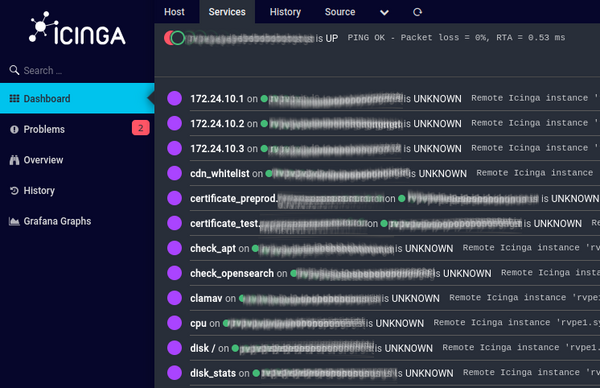
At the same time the host itself remains UP, as the ping/hostalive check is still working fine. It's just the Icinga 2 Agent that doesn't respond.
In an out of memory (OOM) situation, this is pretty bad. The server itself obviously has trouble to respond to anything - not just the locally running Icinga 2 Agent, all services. It's almost identical to a Host DOWN situation, as the services on this remote server are basically all down, however the ping (hostalive check) still responds.
If your Icinga 2 is configured to only send notifications for "OK", "WARNING" and "CRITICAL" service states, you will never get any notification for this situation. Remember, the Host is UP, the services are in an UNKNOWN state.
Such a situation, which we've unfortunately seen a couple of times happening on a customer environment, requires an additional monitoring check. The remote Icinga 2 Agent service needs to be checked; meaning the connectivity between the Icinga 2 Master (or Satellite) and the Icinga 2 Agent.
The Icinga 2 communication usually happens over tcp port 5665. The first idea is obviously to add a "tcp" service check on the Master or Satellite server(s) towards the remote server. But, similar to the ping check, this service check could fool you. On a network level, the Icinga 2 Agent might still listen and respond (send an ack) on port 5665. Yet anything deeper (actual communication) doesn't work. The tcp check is therefore not a proper verification.
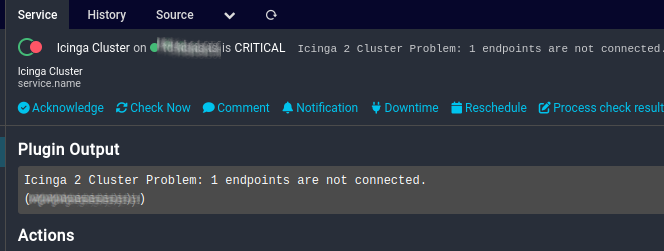
Icinga 2 also features the internal "cluster" check. This is a service check which runs on the Icinga 2 Master server(s) and verifies the whole cluster. "Cluster", in this sense, means the communication between the Icinga 2 Master server(s) and all the configured endpoints. As soon as an endpoint is disconnected, the cluster check triggers a CRITICAL alert.
This works fine if you have just a couple of remote servers using Icinga 2 Agent defined. But in a large setup, with dozens or hundreds of remote servers running Icinga 2 Agent, your "Cluster" service check will likely be triggered frequently.
As soon as just one of the remote servers is rebooted or the Icinga 2 service is restarted right during the "Cluster" service check execution, this triggers a "CRITICAL" state on the cluster service check. You'll see so many state changes of this cluster check that it's not helpful and you'll start to ignore it.
And then, finally, there's yet another approach: cluster-zone.
The internal "cluster-zone" check works similar to the "cluster" check, but supports a command argument "cluster_zone". Thanks to this argument, a specific zone can be defined. Here's such an example shown as Service Object:
# check icinga cluster zone
object Service "Icinga Zone xyz" {
import "generic-service"
host_name = "icinga2-master"
check_command = "cluster-zone"
vars.cluster_zone = "xyz"
}
In the background, Icinga now checks the communication with the endpoint(s) of this zone. In a typical Icinga setup with all or many remote servers running Icinga 2 Agent, the zone name is actually often the same name as the endpoint name. With this "cluster-zone" check you can make sure Icinga is able to communicate to specific zones (and their endpoints).
Note: No, there's no "cluster-endpoint" or similar internal check, that would be focused on endpoints, not zones.
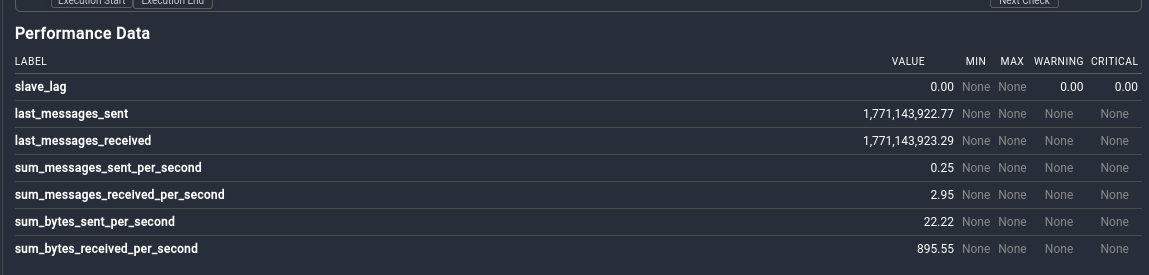
Besides the communication check, the "cluster-zone" check also adds some helpful performance data (metrics) for this zone.
The Service Object above is a good example to monitor one specific zone.
But if you have a large Icinga 2 setup, with dozens or hundreds (or even more) of remote servers and zones, then you want to use a "Service Apply" rule, to dynamically create service checks for each zone.
The problem is now, how do we find all these zones? One approach would be to add a custom variable for each host which defines its zone. For example:
object Host "xyz" {
import "generic-host"
address = "x.x.x.x"
vars.zone = ["xyz"]
[...]
}
An apply rule could then be written to create a new Service Check for each zone. But, as mentioned, this requires that each Host object needs to be adjusted.
There's a better and smarter way.
Icinga 2 supports programmatic approaches, how to handle and manipulate objects. The functions are all described in the library reference documentation. But this is fairly theoretical, there are not many examples showing a practical usage of these functions on the Internet.
The Icinga 2 console can be used to test these functions. Connect to the console using your Icinga 2 API credentials:
root@icinga2:~# icinga2 console --connect 'https://root:secret@localhost:5665/'
Icinga 2 (version: r2.15.2-1)
Type $help to view available commands.
We can now use the "get_objects" function to retrieve information about a specific object type. One of these object types is "Zone":
<1> => get_objects(Zone)
[ {
__name = "director-global"
active = true
all_parents = [ ]
endpoints = null
extensions = {
DbObject = {
type = "Object"
}
}
global = true
ha_mode = 0.000000
[...]
The result is a JSON array for each configured Zone. Obviously, that's a lot of information. All we need are the zone names.
This can be done by joining the "map" function and only use the "name" key of the JSON result:
<3> => get_objects(Zone).map(e => e.name)
[ "director-global", "global-templates", "zzz", "master", "xyz" ]
Great - now we have our list of zones in an array!
But there's one problem with that list: It contains global zones (director-global, global-templates) as well as the master zone. Obviously we only wanted to get a list of remote zones, so we can build our "cluster-zone" checks for communication checks with remote zones.
Once again we can join - yet another - function: The filter function. If you've used the Icinga 2 API, you most likely know the filter function. You can actually even "see it" in use by the Icinga Web2 User Interface:
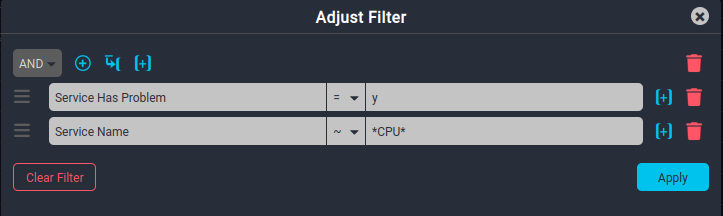
On the API and inside the Console the filter function can be used to filter out specific zones, we don't want to show in the result list. There are several possibilities but we chose to use the regex filter option, to filter out the global zones and the master zone from the result:
<6> => get_objects(Zone).filter(e => !regex("^(global|director|master)", e.name)).map(e => e.name)
[ "zzz", "xyz" ]
The output now only shows our two remote zones "zzz" and "xyz".
With the working Icinga 2 function at hand, we can create a Service Apply rule, that uses the function. Yes, Service Apply rules support functions, although not many examples can be found on the Internet.
root@icinga2:~# cat /etc/icinga2/zones.d/global-templates/applyrules/clusterzones.conf
apply Service "Icinga2 Zone " for (zone in get_objects(Zone).filter(e => !regex("^(global|director|master)", e.name)).map(e => e.name)) {
import "generic-service"
check_command = "cluster-zone"
vars.cluster_zone = zone
assign where host.name == "icinga2-master"
}
The Sevice Apply rule runs through the list of zones, retrieved from the get_objects function, in a loop ( for (key in ...) ) and creates a new Service Object for each detected zone. The zone name, stored in the key called "zone" is automatically applied as value for the "vars.cluster_zone" command attribute.
At the end, the new Service Object is assigned to the "icinga2-master" host, on which the check will run. Depending on your setup, which might include zone satellites, you might have to adjust the Service Apply rule to your needs.
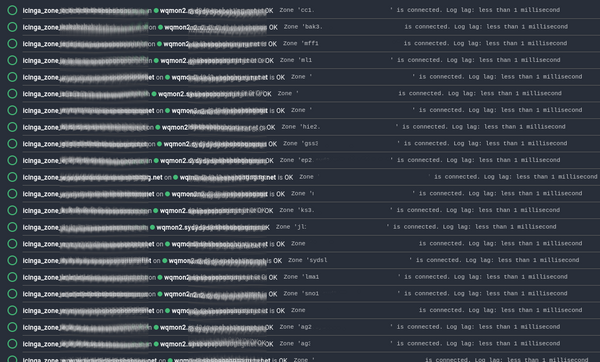
With this Service Apply rule now in place, communication with each zone's endpoint is now actively monitored.
On the Icinga 2 Setup of the mentioned customer, which has hundreds of remote servers with Icinga 2 Agent connected, each zone (and therefore endpoint/server) is its own Service check. In case communication with a zone is disrupted (e.g. OOM on a remote server and Icinga 2 Agent not responding correctly), the Service changes into a CRITICAL state and a notification is sent to the relevant team.
At Infiniroot we have been using Icinga and other monitoring tools for a very long time and have become experts in that topic. In fact, our monitoring journey started over 20 years ago with Nagios.
In our monitoring as a service offering we take care of the technical complexities surrounding a monitoring setup. You and your team simply get the notifications you need and want. Contact us if you want to know more or how we can help with your existing Icinga 2 setup.