
Of course we cannot always share details about our work with customers, but nevertheless it is nice to show our technical achievements and share some of our implemented solutions.
Back in 2010 I created automatic availability reporting from a Nagios installation (see How to create automatic PDF from Nagios Availability Reports?). The idea was pretty simple: In a monthly interval (generally running on the 1st of the moth) simply create a PDF from the availability report (using the previous month's data) and send it by mail.
Methods (and knowledge) have changed since and I was asked to create an automatic SLA reporting using the statistics from Icinga 2.Initially sending the report by e-mail would have been enough, but when I came across Confluence's REST API, the goal was to directly add the reporting into Confluence.
Note: Icinga's new interface icingaweb2 does not support availability reporting as of April 2018. We're still using icinga2-classicui for this purpose.
The script I created is split into several steps. Let's go through them.
At the begin of the script, I defined some base variables which will later be used in the script.
# Basic variable definitions
yearlastmonth=$(dateutils.dadd today -1mo -f '%Y')
monthlastmonth=$(dateutils.dadd today -1mo -f '%m')
availurl="http://icinga.example.com/cgi-bin/icinga2-classicui/avail.cgi"
icingauser="icingaadmin"
icingapass="password"
wikiuser="slareporter"
wikipass="dd2ddAADw2"
You might have noticed that I'm using dateutils.dadd instead of date to determine the year and month of the previous month. Take a look at my article "Bash: date -d 1 month ago still shows the same month" to see why.
The availurl variable contains the address to your Nagios' or Icinga's avail.cgi.
The two credentials are used to login on avail.cgi and on the Confluence Wiki.
By using wkhtmltopdf, the availability report seen in the Nagios or Icinga2-ClassicUI interface, can be saved as a PDF (including formatting, colors, etc). The command is pretty simple:
xvfb-run -a -s "-screen 0 640x480x16" wkhtmltopdf --username $icingauser --password $icingapass "${availurl}?show_log_entries=&host=internet&service=HTTP+www.example.com&timeperiod=lastmonth" /tmp/${yearlastmonth}${monthlastmonth}-www.example.com.pdf
xvfb-run is used to run wkhtmltopdf in a non-interactive way. Otherwise wkhtmltopdf would complain about a missing X display.
Of course the important parameters in the requested URL are: host=internet (which is the host object), service=HTTP+www.example.com (the service object we want the report from) and timeperiod=lastmonth (get the statistics for the previous month).
Because now is April 2018, the PDF document is saved as /tmp/2018-03-www.example.com.pdf.
The upload of a file/attachment is pretty easy, compared to changing the content of a page (more on that later):
curl -s -S -u "${wikiuser}:${wikipass}" -X POST -H "X-Atlassian-Token: no-check" -F "file=@/tmp/${yearlastmonth}${monthlastmonth}-www.example.com.pdf" -F "comment=${yearlastmonth}-${monthlastmonth} www.example.com" "https://wiki.example.com/confluence/rest/api/content/12345678/child/attachment"| python -mjson.tool
Obviously the generated PDF is uploaded using -F "file=@/tmp/${yearlastmonth}${monthlastmonth}-www.example.com.pdf".
Don't forget to adjust the Confluence host address (here wiki.example.com) and the page ID (here 12345678). You can find the page ID either in the address or in the "Page information" of the relevant page.
After successful upload, the PDF will appear as attachment on that Confluence page.
As you might know, the availability report (we created the report pdf of) can also be displayed in another format: csv, json, xml.
With a json parser like jshon, the value of the field "percent_known_time_ok" (inside the "services" array) can be directly shown:
availpercent=$(curl -s -u "${icingauser}:${icingapass}" "${availurl}?show_log_entries=&hostservice=internet^HTTP+www.example.com&assumeinitialstates=yes&assumestateretention=yes&assumestatesduringnotrunning=yes&includesoftstates=no&initialassumedhoststate=0&initialassumedservicestate=0&timeperiod=lastmonth&backtrack=8&jsonoutput" | jshon -e avail -e service_availability -e services -a -e percent_known_time_ok | awk '{printf("%.3f\n", $1)}')
If you want to see the structure of the json output, simply click on the "export to json" button in the user interface.
I'm using the awk command in the end to get a maximum of 3 decimals for the value. E.g. 99.335654 will be cut to 99.335.
But under some circumstances it's possible that the json output cannot be handled by jshon ("too big integer"). This happened on a service where at the begin of the month recurring downtimes were set, but at the end of the month they were removed. This caused a miscalculation in the report and created a huge field number ("time_critical_unscheduled": 18446744073709548794). I opened an issue on the Github project for jshon to address this. In the meantime I created the following workaround:
# In some cases, we could hit a json parsing error due to a too big integer. In such a case we try the csv output.
if [[ $? -gt 0 ]] || [[ -z $availpercent ]]
then availpercent=$(curl -s -u "${icingauser}:${icingapass}" "${availurl}?show_log_entries=&hostservice=internet^HTTP+www.example.com&timeperiod=lastmonth&rpttimeperiod=24x7&assumeinitialstates=yes&assumestateretention=yes&assumestatesduringnotrunning=yes&includesoftstates=no&initialassumedservicestate=6&backtrack=8&content_type=csv" | grep "internet" | awk -F';' '{print $11}' | sed "s/'//g" | sed "s/%//g")
fi
In case the pevious command failed or the previously defined variable $availpercent is empty, the csv output of the same service will be accessed. The parsing is of course different; here I'm interested in the 11th column (which is percent_known_time_ok).
Here's a very important information: If you want to change the content of a Confluence page, you need to:
Let's do this slowly:
# Get current version number and content from wiki page
wikiversion=$(curl -s -u "${wikiuser}:${wikipass}" "https://wiki.example.com/confluence/rest/api/content/12345678?expand=version" | python -mjson.tool | jshon -e version -e number)
wikicontent=$(curl -s -u "${wikiuser}:${wikipass}" "https://wiki.example.com/confluence/rest/api/content/12345678?expand=body.storage" | python -mjson.tool | jshon -e body -e storage -e value)
Here again I'm using jshon to get the values of the fields and save them into variables "wikiversion" and "wikicontent".
Note: The value saved in $wikiversion is a number, the value in $wikicontent is a string already containing doublequotes.
The Wiki page I prepared simply contained a table and I wanted to add a new row for the previous month at the end of the table.
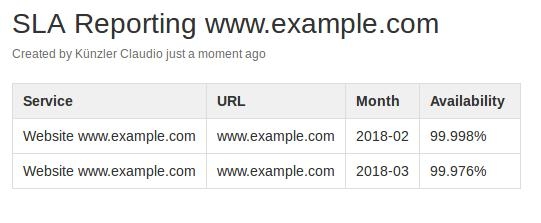
This means I have to add the new row right before the code marking the end of the table. I chose sed for this:
# Change content (add new row at bottom of table)
newcontent=$(echo $wikicontent | sed "s#<\\\\/tbody>#Website www.example.com<\\\/td>https://www.example.com<\\\/td>${yearlastmonth}-${monthlastmonth}<\\\/td>${availpercent}%<\\\/td><\\\/tr><\\\/tbody>#")
Note the crazy amount of backslashes. This is because the escaped backslashes need to remain in the final submit (compare with the value of $wikicontent).
We only need to increase the version number of the Wiki page:
# Increment version number
newversion=$(( $wikiversion + 1 ))
OK, now we're finally ready to upload the change to Confluence:
# Update Wiki page
curl -s -u "${wikiuser}:${wikipass}" -X PUT -H 'Content-Type: application/json' -d "{\"id\":\"12345678\",\"type\":\"page\",\"title\":\"SLA Reporting www.example.com\",\"space\":{\"key\":\"SysServices\"},\"body\":{\"storage\":{\"value\":$newcontent,\"representation\":\"storage\"}},\"version\":{\"number\":$newversion}}" https://wiki.example.com/confluence/rest/api/content/12345678 | python -mjson.tool
Note that $newcontent was not put into additional double-quotes. As mentioned before, the original value ($wikicontent) already starts and ends with double-quotes.
$newversion was also not put into (double-) quotes because it's a number, not a string.
I went one step further and instead of having a huge script with hundreds of lines for each service we want SLA reporting, I added some parameters at the begin:
# Get user-given variables (dynamic)
while getopts "T:U:W:P:H:S:" Input;
do
case ${Input} in
T) title=${OPTARG};;
U) url=${OPTARG};;
W) wikiid=${OPTARG};;
P) wikipagetitle=${OPTARG};;
H) icingahost=${OPTARG};;
S) icingaservice=${OPTARG};;
*) echo "Wrong option given."
exit 1
;;
esac
done
# Before we do anything, check if we have all information
if [[ -z $title ]]; then echo "Missing title, use -T"; exit 1
elif [[ -z $url ]]; then echo "Missing URL, use -U"; exit 1
elif [[ -z $wikiid ]]; then echo "Missing Wiki page ID, use -W"; exit 1
elif [[ -z $wikipagetitle ]]; then echo "Missing Wiki page title, use -P"; exit 1
elif [[ -z $icingahost ]]; then echo "Missing Icinga host name of this SLA, use -H"; exit 1
elif [[ -z $icingaservice ]]; then echo "Missing Icinga service name of this SLA, use -S"; exit 1
fi
This way I can launch the script for many services, each with its own Wiki page (if necessary):
# crontab -l
# SLA Reportings
00 02 1 * * /root/scripts/icinga-sla-reporting.sh -T "Website www.example.com" -U "www.example.com" -W 12345678 -P "SLA Reporting www.example.com" -H internet -S "HTTP+www.example.com" >/dev/null
01 02 1 * * /root/scripts/icinga-sla-reporting.sh -T "Rest API api.example.com" -U "api.example.com" -W 12312399 -P "SLA Reporting api.example.com" -H internet -S "HTTP+api.example.com" >/dev/null
Unfortunately recent Icinga 2 updates removed the icinga2-classicui interface (see Icinga2-classicui is gone after installing Icinga 2 2.10) and therefore also the cgi scripts needed to create the SLA statistics. As a workaround I have adjusted the script to use Thruk's SLA reporting plugin.
There is also (slow) work in progress on a reporting module for icingaweb2. It is generally available, however it lacks depth compared to Thruk's reporting module.