
Of course we cannot always share details about our work with customers, but nevertheless it is nice to show our technical achievements and share some of our implemented solutions.
In our container environment, the Docker daemon collects stdout and stderr logs from the Docker containers (see article Application (Docker/Kubernetes) containers and STDOUT logging for more information) and sends these logs by using the GELF logging driver to a central Logstash. When we implemented the ELK stack in 2017, we chose GELF over the syslog and json-file drivers because:
This resulted in the following entry in /etc/docker/daemon.json:
root@dockerhost:~# cat /etc/docker/daemon.json
{
"log-driver": "gelf",
"log-opts": {
"gelf-address": "udp://logstash.example.com:5000",
"tag": "docker: {{.Name}}"
}
}
But since that implementation there was something odd happening. We "felt" that some logs were missing in the ELK stack. So we started a container which basically sent a log line to STDOUT every second and looked these logs up in Kibana. And our intuition was proofed correct:
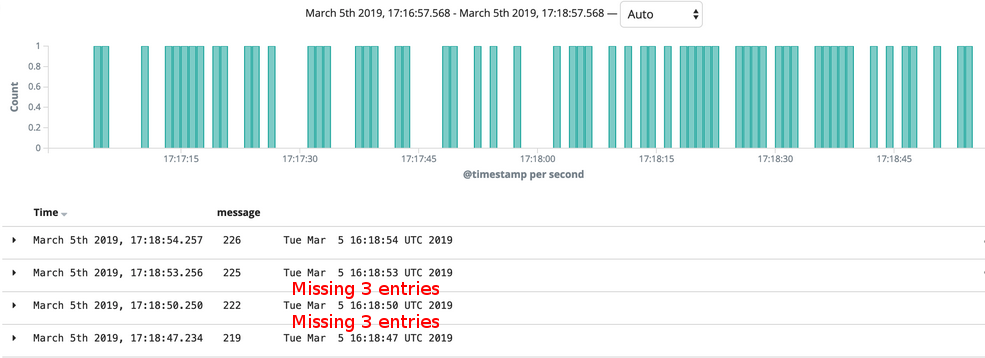
There are clearly missing log entries as one can see in the graph and also the list of events below.
We suspected this due to GELF's usage of the UDP protocol. As you may be well aware, UDP is a "fire and forget" protocol. The sender just sends data using UDP and does not await a "success feedback" from the recipient side. But when we started with the GELF logging to Logstash in 2017, there was only the possibility to use the UDP protocol.
In a later Docker version (17.11.0-ce, released at the end of 2017) the TCP protocol was added to the GELF logging driver:
Add TCP support for GELF log driver moby/moby#34758
A fix in Docker 18.01.0-ce (released early 2018) suggests that after this release, GELF tcp logging became more stable:
Fix daemon crash when using the GELF log driver over TCP when the GELF server goes down moby/moby#35765
Since we got aware that GELF now supports TCP, we were eager to test this. After the Docker hosts were upgraded to a recent Docker version (18.06-1.ce) we changed the /etc/docker/daemon.json file to use TCP instead of UDP.
A few hours later we were able to compare graphs udp vs. tcp logging. And indeed, the world looked brighter using tcp:
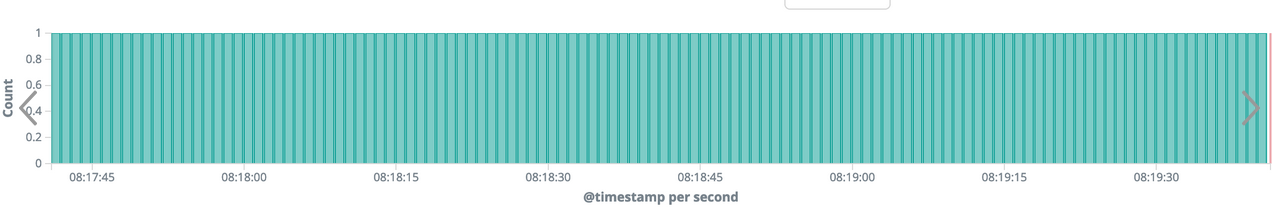
The log entries sent every second from the logging container all arrived and were shown cleanly in Kibana. We thought we found the solution to the missing log entries.
This week our ELK stack ran into problems and we needed to restart the Elasticsearch cluster. This forced ES to re-index all indexes, around 2 x 4 TB (as of this writing, re-indexing is still not completed). Since then we have experienced weird issues on our test and staging environments. Some containers failed to stop, which caused the continuous deployments to hang. Only a manual restart of the Docker service was able to help.
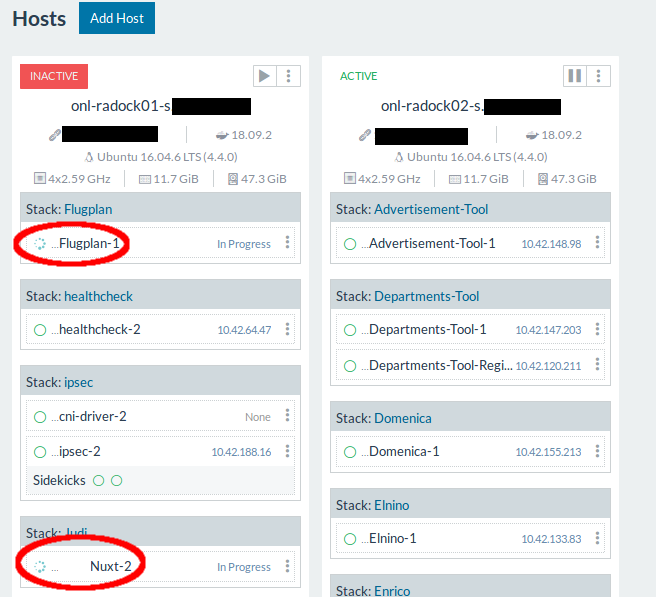
At the begin we did not expect a connection to ELK's issues but today we ran into similar problems on production when I continued to switch from UDP to TCP logging. The applications were running so slowly they were not usable anymore and containers were unable to stop. Again this only happened on Docker hosts which were configured to use GELF logging using the TCP protocol.
Once test and staging environments and the affected production hosts were switched back to UDP logging, the issues were gone.
How could this be explained? By checking the documentation of GELF itself, there is an important hint:
Of course TCP would solve this problem on a transport layer but it brings other problems that are even harder to tackle: You would have to care about slow connections, timeouts and other nasty network problems. With UDP you may just lose a message while with TCP it could bring your whole application down when not designed with care.
As our Elasticsearch cluster is currently partly down and is busy re-indexing, this results in such entries found on Logstash:
[2019-04-03T12:02:34,442][INFO ][logstash.outputs.elasticsearch] retrying failed action with response code: 429 ({"type"=>"es_rejected_execution_exception", "reason"=>"rejected execution of processing of [3091065][indices:data/write/bulk[s][p]]: request: BulkShardRequest [[docker-2019.04.03][1]] [...] target allocation id: yo6XeqMlQFyLCwYUY1t0Cg, primary term: 1 on EsThreadPoolExecutor[name = elasticsearch02/write, queue capacity = 200, org.elasticsearch.common.util.concurrent.EsThreadPoolExecutor@2163202f[Running, pool size = 4, active threads = 4, queued tasks = 200, completed tasks = 849]]"})
So these messages are slowing down heavily Logstash. Which might (most likely) cause a delay on the initial log sender (the Docker host) waiting for a TCP ack/success response from Logstash but doesn't get it in a timely manner.
A problem somewhere in the network or in the ELK stack itself is always possible. But risking that application start to fail because of a logging problem? No, we don't want that. We decided to roll back and continue to use GELF logging with UDP for now. We might look at other logging solutions (Filebeat with json-file logging driver?) in the future.