
Of course we cannot always share details about our work with customers, but nevertheless it is nice to show our technical achievements and share some of our implemented solutions.
Today I came across a strange problem on our Elasticsearch (6.5.x): No data was written into ES anymore. Instead a lot of errors were logged:
[2019-09-09T07:16:17,475][ERROR][o.e.x.w.e.ExecutionService] [es01] could not store triggered watch with id [prOmO-8rSreTrgLGraNv6w_kibana_version_mismatch_7badcd4a-1d05-4c61-841d-6feb5ac0f502-2019-09-09T05:16:17.472Z]: [RemoteTransportException[[es01][10.161.206.51:9300][indices:data/write/bulk[s][p]]]; nested: EsRejectedExecutionException[rejected execution of processing of [1079478][indices:data/write/bulk[s][p]]: request: BulkShardRequest [[.triggered_watches][0]] containing [6] requests, target allocation id: SgkOgkxKRwOXk9T1mOukCw, primary term: 25 on EsThreadPoolExecutor[name = es01/write, queue capacity = 200, org.elasticsearch.common.util.concurrent.EsThreadPoolExecutor@3fefa84b[Running, pool size = 8, active threads = 8, queued tasks = 9477, completed tasks = 29772]]];]
[2019-09-09T07:16:17,475][ERROR][o.e.x.w.e.ExecutionService] [es01] could not store triggered watch with id [prOmO-8rSreTrgLGraNv6w_elasticsearch_cluster_status_e17aa37d-a3af-431a-a6fe-1cde37b98016-2019-09-09T05:16:17.472Z]: [RemoteTransportException[[es01][10.161.206.51:9300][indices:data/write/bulk[s][p]]]; nested: EsRejectedExecutionException[rejected execution of processing of [1079478][indices:data/write/bulk[s][p]]: request: BulkShardRequest [[.triggered_watches][0]] containing [6] requests, target allocation id: SgkOgkxKRwOXk9T1mOukCw, primary term: 25 on EsThreadPoolExecutor[name = es01/write, queue capacity = 200, org.elasticsearch.common.util.concurrent.EsThreadPoolExecutor@3fefa84b[Running, pool size = 8, active threads = 8, queued tasks = 9477, completed tasks = 29772]]];]
[2019-09-09T07:16:17,475][ERROR][o.e.x.w.e.ExecutionService] [es01] could not store triggered watch with id [prOmO-8rSreTrgLGraNv6w_elasticsearch_nodes_d0a9b8d6-26e8-4cac-b185-066e24bd0692-2019-09-09T05:16:17.472Z]: [RemoteTransportException[[es01][10.161.206.51:9300][indices:data/write/bulk[s][p]]]; nested: EsRejectedExecutionException[rejected execution of processing of [1079478][indices:data/write/bulk[s][p]]: request: BulkShardRequest [[.triggered_watches][0]] containing [6] requests, target allocation id: SgkOgkxKRwOXk9T1mOukCw, primary term: 25 on EsThreadPoolExecutor[name = es01/write, queue capacity = 200, org.elasticsearch.common.util.concurrent.EsThreadPoolExecutor@3fefa84b[Running, pool size = 8, active threads = 8, queued tasks = 9477, completed tasks = 29772]]];]
[2019-09-09T07:16:18,484][ERROR][o.e.a.b.TransportBulkAction] [es01] failed to execute pipeline for a bulk request
org.elasticsearch.common.util.concurrent.EsRejectedExecutionException: rejected execution of org.elasticsearch.ingest.IngestService$4@3e5fc46d on EsThreadPoolExecutor[name = es01/write, queue capacity = 200, org.elasticsearch.common.util.concurrent.EsThreadPoolExecutor@3fefa84b[Running, pool size = 8, active threads = 8, queued tasks = 9477, completed tasks = 29772]]
at org.elasticsearch.common.util.concurrent.EsAbortPolicy.rejectedExecution(EsAbortPolicy.java:48) ~[elasticsearch-6.5.4.jar:6.5.4]
at java.util.concurrent.ThreadPoolExecutor.reject(ThreadPoolExecutor.java:830) ~[?:1.8.0_201]
at java.util.concurrent.ThreadPoolExecutor.execute(ThreadPoolExecutor.java:1379) ~[?:1.8.0_201]
at org.elasticsearch.common.util.concurrent.EsThreadPoolExecutor.doExecute(EsThreadPoolExecutor.java:98) ~[elasticsearch-6.5.4.jar:6.5.4]
at org.elasticsearch.common.util.concurrent.EsThreadPoolExecutor.execute(EsThreadPoolExecutor.java:93) ~[elasticsearch-6.5.4.jar:6.5.4]
at org.elasticsearch.ingest.IngestService.executeBulkRequest(IngestService.java:381) ~[elasticsearch-6.5.4.jar:6.5.4]
at org.elasticsearch.action.bulk.TransportBulkAction.processBulkIndexIngestRequest(TransportBulkAction.java:530) ~[elasticsearch-6.5.4.jar:6.5.4]
at org.elasticsearch.action.bulk.TransportBulkAction.executeIngestAndBulk(TransportBulkAction.java:235) ~[elasticsearch-6.5.4.jar:6.5.4]
at org.elasticsearch.action.bulk.TransportBulkAction.doExecute(TransportBulkAction.java:169) ~[elasticsearch-6.5.4.jar:6.5.4]
at org.elasticsearch.action.bulk.TransportBulkAction.doExecute(TransportBulkAction.java:89) ~[elasticsearch-6.5.4.jar:6.5.4]
at org.elasticsearch.action.support.TransportAction$RequestFilterChain.proceed(TransportAction.java:167) ~[elasticsearch-6.5.4.jar:6.5.4]
at org.elasticsearch.xpack.security.action.filter.SecurityActionFilter.lambda$apply$0(SecurityActionFilter.java:90) ~[?:?]
at org.elasticsearch.action.ActionListener$1.onResponse(ActionListener.java:60) ~[elasticsearch-6.5.4.jar:6.5.4]
at org.elasticsearch.xpack.security.action.filter.SecurityActionFilter.lambda$authorizeRequest$4(SecurityActionFilter.java:179) ~[?:?]
at org.elasticsearch.xpack.security.authz.AuthorizationUtils$AsyncAuthorizer.maybeRun(AuthorizationUtils.java:173) ~[?:?]
at org.elasticsearch.xpack.security.authz.AuthorizationUtils$AsyncAuthorizer.setRunAsRoles(AuthorizationUtils.java:167) ~[?:?]
at org.elasticsearch.xpack.security.authz.AuthorizationUtils$AsyncAuthorizer.authorize(AuthorizationUtils.java:155) ~[?:?]
at org.elasticsearch.xpack.security.action.filter.SecurityActionFilter.authorizeRequest(SecurityActionFilter.java:181) ~[?:?]
at org.elasticsearch.xpack.security.action.filter.SecurityActionFilter.lambda$applyInternal$3(SecurityActionFilter.java:159) ~[?:?]
at org.elasticsearch.action.ActionListener$1.onResponse(ActionListener.java:60) ~[elasticsearch-6.5.4.jar:6.5.4]
at org.elasticsearch.xpack.security.authc.AuthenticationService$Authenticator.lambda$authenticateAsync$2(AuthenticationService.java:176) ~[?:?]
at org.elasticsearch.xpack.security.authc.AuthenticationService$Authenticator.lambda$lookForExistingAuthentication$4(AuthenticationService.java:209) ~[?:?]
at org.elasticsearch.xpack.security.authc.AuthenticationService$Authenticator.lookForExistingAuthentication(AuthenticationService.java:220) ~[?:?]
at org.elasticsearch.xpack.security.authc.AuthenticationService$Authenticator.authenticateAsync(AuthenticationService.java:174) ~[?:?]
at org.elasticsearch.xpack.security.authc.AuthenticationService$Authenticator.access$000(AuthenticationService.java:134) ~[?:?]
at org.elasticsearch.xpack.security.authc.AuthenticationService.authenticate(AuthenticationService.java:104) ~[?:?]
at org.elasticsearch.xpack.security.action.filter.SecurityActionFilter.applyInternal(SecurityActionFilter.java:158) ~[?:?]
at org.elasticsearch.xpack.security.action.filter.SecurityActionFilter.lambda$apply$2(SecurityActionFilter.java:104) ~[?:?]
at org.elasticsearch.xpack.core.security.SecurityContext.executeAsUser(SecurityContext.java:94) ~[?:?]
at org.elasticsearch.xpack.security.authz.AuthorizationUtils.switchUserBasedOnActionOriginAndExecute(AuthorizationUtils.java:114) ~[?:?]
at org.elasticsearch.xpack.security.action.filter.SecurityActionFilter.apply(SecurityActionFilter.java:102) ~[?:?]
at org.elasticsearch.action.support.TransportAction$RequestFilterChain.proceed(TransportAction.java:165) ~[elasticsearch-6.5.4.jar:6.5.4]
at org.elasticsearch.action.support.TransportAction.execute(TransportAction.java:139) ~[elasticsearch-6.5.4.jar:6.5.4]
at org.elasticsearch.action.support.TransportAction.execute(TransportAction.java:81) ~[elasticsearch-6.5.4.jar:6.5.4]
at org.elasticsearch.client.node.NodeClient.executeLocally(NodeClient.java:87) ~[elasticsearch-6.5.4.jar:6.5.4]
at org.elasticsearch.client.node.NodeClient.doExecute(NodeClient.java:76) ~[elasticsearch-6.5.4.jar:6.5.4]
at org.elasticsearch.client.support.AbstractClient.execute(AbstractClient.java:395) ~[elasticsearch-6.5.4.jar:6.5.4]
at org.elasticsearch.client.support.AbstractClient.bulk(AbstractClient.java:472) ~[elasticsearch-6.5.4.jar:6.5.4]
at org.elasticsearch.xpack.core.ClientHelper.executeAsyncWithOrigin(ClientHelper.java:74) ~[x-pack-core-6.5.4.jar:6.5.4]
at org.elasticsearch.xpack.monitoring.exporter.local.LocalBulk.doFlush(LocalBulk.java:108) ~[?:?]
at org.elasticsearch.xpack.monitoring.exporter.ExportBulk.flush(ExportBulk.java:60) ~[?:?]
at org.elasticsearch.xpack.monitoring.exporter.ExportBulk$Compound.lambda$doFlush$1(ExportBulk.java:154) ~[?:?]
at org.elasticsearch.xpack.core.common.IteratingActionListener.run(IteratingActionListener.java:102) [x-pack-core-6.5.4.jar:6.5.4]
at org.elasticsearch.xpack.monitoring.exporter.ExportBulk$Compound.doFlush(ExportBulk.java:170) [x-pack-monitoring-6.5.4.jar:6.5.4]
at org.elasticsearch.xpack.monitoring.exporter.ExportBulk.flushAndClose(ExportBulk.java:84) [x-pack-monitoring-6.5.4.jar:6.5.4]
at org.elasticsearch.xpack.monitoring.exporter.ExportBulk.close(ExportBulk.java:74) [x-pack-monitoring-6.5.4.jar:6.5.4]
at org.elasticsearch.xpack.monitoring.exporter.Exporters.export(Exporters.java:196) [x-pack-monitoring-6.5.4.jar:6.5.4]
at org.elasticsearch.xpack.monitoring.action.TransportMonitoringBulkAction$AsyncAction$1.doRun(TransportMonitoringBulkAction.java:147) [x-pack-monitoring-6.5.4.jar:6.5.4]
at org.elasticsearch.common.util.concurrent.ThreadContext$ContextPreservingAbstractRunnable.doRun(ThreadContext.java:723) [elasticsearch-6.5.4.jar:6.5.4]
at org.elasticsearch.common.util.concurrent.AbstractRunnable.run(AbstractRunnable.java:37) [elasticsearch-6.5.4.jar:6.5.4]
at java.util.concurrent.ThreadPoolExecutor.runWorker(ThreadPoolExecutor.java:1149) [?:1.8.0_201]
at java.util.concurrent.ThreadPoolExecutor$Worker.run(ThreadPoolExecutor.java:624) [?:1.8.0_201]
at java.lang.Thread.run(Thread.java:748) [?:1.8.0_201]
Yeah - pretty long error (as always with Java apps).
The relevant and important part is much shorter:
EsThreadPoolExecutor[name = es01/write, queue capacity = 200, org.elasticsearch.common.util.concurrent.EsThreadPoolExecutor@3fefa84b[Running, pool size = 8, active threads = 8, queued tasks = 9477, completed tasks = 29772]]];]
The error indicates that the "write" thread pool on node "es01" has a queue capacity of 200, yet there are currently 9477 queued tasks. You don't have to be a genius to understand, that obviously the queue capacity is not sufficient. But what does Elasticsearch do in such an event? It stops the execution of that request. In this case however, the queue size remained very high and Elasticsearch just never got back into a working state. Yet Elasticsearch itself said everything was alright and the cluster returned a "green" status. Not very helpful, to be honest.
If only there would be something to catch this problem...
There are actually several ways to see the statistics of the thread pools. One of it is to check the stats within the _nodes context.
$ curl -s http://localhost:9200/_nodes/es01/stats/thread_pool?human&pretty
{
"_nodes" : {
"total" : 1,
"successful" : 1,
"failed" : 0
},
"cluster_name" : "elk",
"nodes" : {
"0o0eQXxcSJuWIFG2ohjwUg" : {
"timestamp" : 1568006575346,
"name" : "es01",
"transport_address" : "192.168.100.101:9300",
"host" : "192.168.100.101",
"ip" : "192.168.100.101:9300",
"roles" : [
"master",
"data",
"ingest"
],
"attributes" : {
"ml.machine_memory" : "48535076864",
"ml.max_open_jobs" : "20",
"xpack.installed" : "true",
"ml.enabled" : "true"
},
"thread_pool" : {
"analyze" : {
"threads" : 0,
"queue" : 0,
"active" : 0,
"rejected" : 0,
"largest" : 0,
"completed" : 0
},
"ccr" : {
"threads" : 1,
"queue" : 0,
"active" : 0,
"rejected" : 0,
"largest" : 1,
"completed" : 1
},
"fetch_shard_started" : {
"threads" : 1,
"queue" : 0,
"active" : 0,
"rejected" : 0,
"largest" : 16,
"completed" : 812
},
"fetch_shard_store" : {
"threads" : 1,
"queue" : 0,
"active" : 0,
"rejected" : 0,
"largest" : 16,
"completed" : 817
},
"flush" : {
"threads" : 1,
"queue" : 0,
"active" : 0,
"rejected" : 0,
"largest" : 4,
"completed" : 442
},
"force_merge" : {
"threads" : 0,
"queue" : 0,
"active" : 0,
"rejected" : 0,
"largest" : 0,
"completed" : 0
},
"generic" : {
"threads" : 26,
"queue" : 0,
"active" : 1,
"rejected" : 0,
"largest" : 26,
"completed" : 2920066
},
"get" : {
"threads" : 8,
"queue" : 0,
"active" : 0,
"rejected" : 0,
"largest" : 8,
"completed" : 51218
},
"index" : {
"threads" : 6,
"queue" : 0,
"active" : 0,
"rejected" : 0,
"largest" : 6,
"completed" : 6
},
"listener" : {
"threads" : 0,
"queue" : 0,
"active" : 0,
"rejected" : 0,
"largest" : 0,
"completed" : 0
},
"management" : {
"threads" : 5,
"queue" : 0,
"active" : 1,
"rejected" : 0,
"largest" : 5,
"completed" : 168441
},
"ml_autodetect" : {
"threads" : 0,
"queue" : 0,
"active" : 0,
"rejected" : 0,
"largest" : 0,
"completed" : 0
},
"ml_datafeed" : {
"threads" : 0,
"queue" : 0,
"active" : 0,
"rejected" : 0,
"largest" : 0,
"completed" : 0
},
"ml_utility" : {
"threads" : 18,
"queue" : 0,
"active" : 0,
"rejected" : 0,
"largest" : 18,
"completed" : 18
},
"refresh" : {
"threads" : 4,
"queue" : 0,
"active" : 0,
"rejected" : 0,
"largest" : 4,
"completed" : 41716166
},
"rollup_indexing" : {
"threads" : 0,
"queue" : 0,
"active" : 0,
"rejected" : 0,
"largest" : 0,
"completed" : 0
},
"search" : {
"threads" : 13,
"queue" : 0,
"active" : 0,
"rejected" : 50,
"largest" : 13,
"completed" : 359700
},
"search_throttled" : {
"threads" : 0,
"queue" : 0,
"active" : 0,
"rejected" : 0,
"largest" : 0,
"completed" : 0
},
"security-token-key" : {
"threads" : 0,
"queue" : 0,
"active" : 0,
"rejected" : 0,
"largest" : 0,
"completed" : 0
},
"snapshot" : {
"threads" : 0,
"queue" : 0,
"active" : 0,
"rejected" : 0,
"largest" : 0,
"completed" : 0
},
"warmer" : {
"threads" : 1,
"queue" : 0,
"active" : 0,
"rejected" : 0,
"largest" : 4,
"completed" : 269
},
"watcher" : {
"threads" : 40,
"queue" : 1000,
"active" : 40,
"rejected" : 9,
"largest" : 40,
"completed" : 3
},
"write" : {
"threads" : 8,
"queue" : 9499,
"active" : 8,
"rejected" : 95863,
"largest" : 8,
"completed" : 29772
}
}
}
}
}
And indeed: the watcher and write queues at the end have very high numbers! And look at the rejected numbers of the write thread pool, too!
Another method is to check the thread pools using cat thread pool API.
Yes, that's exactly where this article is going! If the write thread pool would have been monitored (with thresholds), an alert would have been sent and the Elasticsearch cluster would have been fixed quickly. Instead, the whole ELK stack was down for the weekend. Luckily there's the monitoring plugin check_es_system at hand.
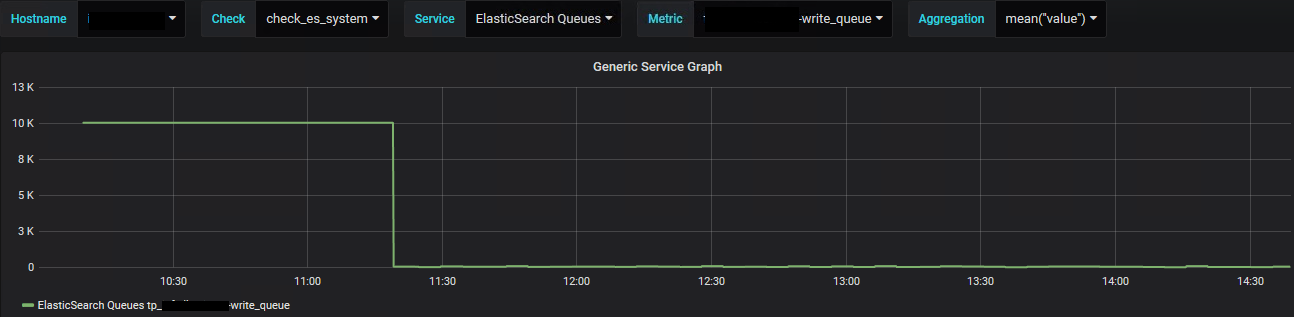
The monitoring plugin check_es_system, a plugin to monitor Elasticsearch clusters and nodes, now allows to monitor exactly these thread pools. Using the new check type -t tps (thread pool statistics) allows to create performance data for every thread pool available and alert if a threshold is reached. The following graph shows how the write queue drops after Elasticsearch was restarted:
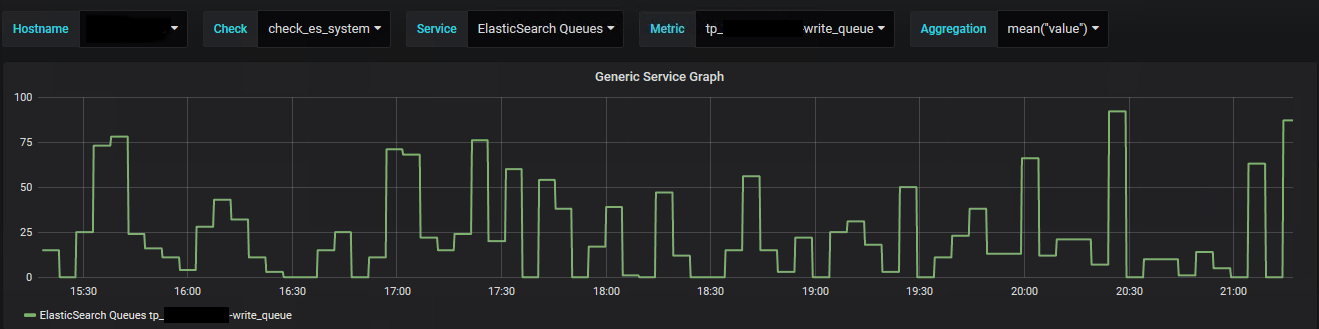
And during normal operations:
Besides the thread pools it is now also possible to monitor the total number of JVM threads in the whole cluster using -t jthreads.
Unfortunately, only a restart of that Elasticsearch node helped to finally resolve this issue. If this very issue happens again, we'll be notified quickly because now the thread pools are being monitored - which will reduce the downtime significantly.
Note: At the same time I also upgraded from 6.5 to 6.8, which seemed to bring some additional performance.