
Of course we cannot always share details about our work with customers, but nevertheless it is nice to show our technical achievements and share some of our implemented solutions.
Kibana might at some point throw an error on dashboards or visualizations: X of Y shards failed.
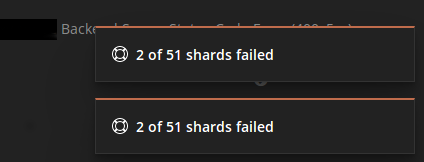
The problem? This error message is not helpful at all.
Once familiar with the Elastic Stack (previously known as ELK Stack) one knows that Elasticsearch's indexes are split into shards onto one or more nodes. Kibana's error message clearly indicates failed shards, so something must have gone bad with shards in Elasticsearch, right?
Wrong! Although Kibana mentions shards failed, all shards are working correctly as they should. This can be verified in Elasticsearch itself:
root@es:~# curl -s http://localhost:9200/_cat/shards?pretty | egrep -v STARTED; echo "result"
result
Meaning: All shards are correctly started.
But why would Kibana still mention to failed shards?
As the error shows up in Kibana and therefore in the browser, opening the browser console (F12) helps to show additional information. Inside the json-formatted response , failures are quite nicely listed for each shard. And more importantly: The reason why the shard(s) failed appears, too!
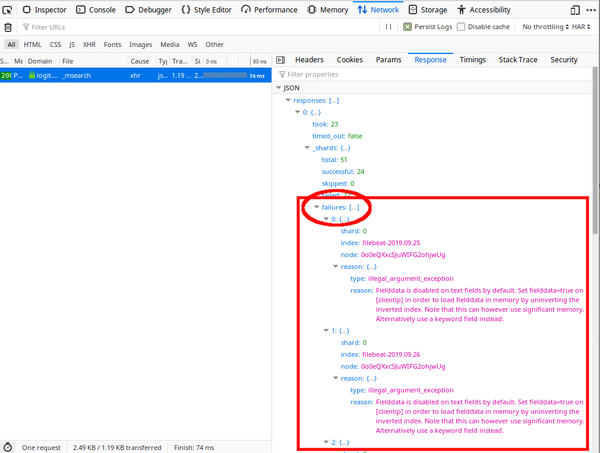
One important hint to find the reason for the error message was retrieved:
Fielddata is disabled on text fields by default. Set fielddata=true on [response] in order to load fielddata in memory by uninverting the inverted index. Note that this can however use significant memory. Alternatively use a keyword field instead.
Finally some useful error message.
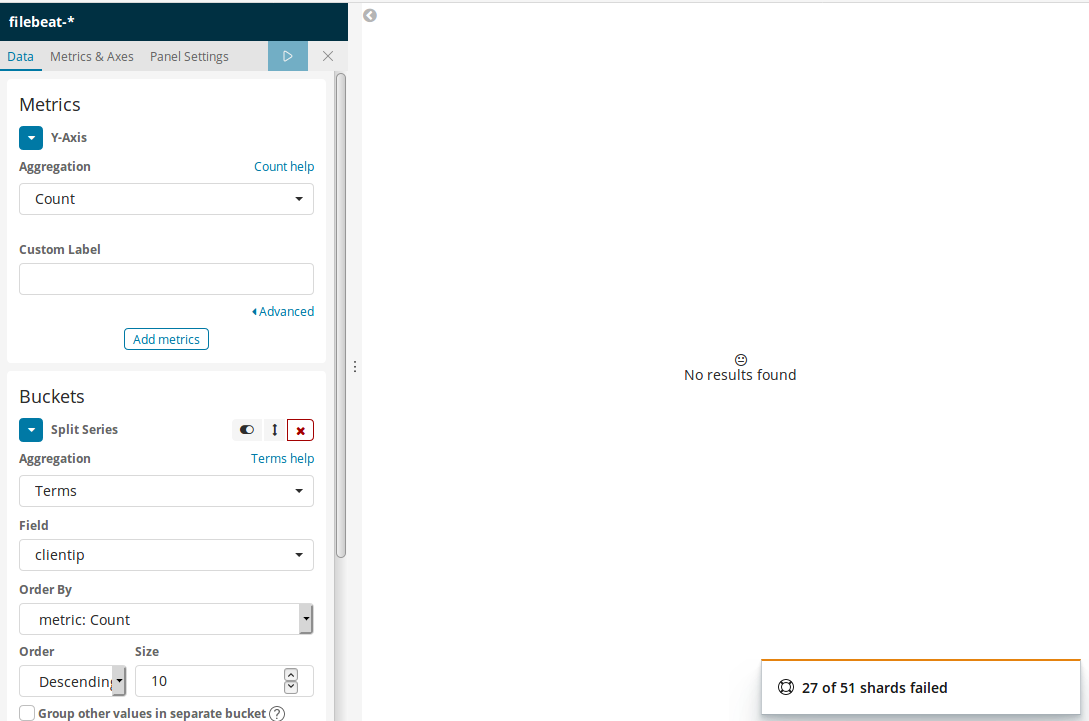
This might be a (helpful) spoiler, but the error itself comes from the data visualizations. Or dashboards, as a dashboard is just a collection of visualizations. To figure out why a certain visualization returns this error, the data itself must be checked; what data or field is the visualization supposed to show?
In this particular example the filebeat-* index is analyzed and the text field "clientip" is supposed to show up as visualized data. But the graph fails to show data and, yet again, the error message X of Y shards failed shows up:
The research of the previous error message (fielddata is disabled on text fields) leads to the official Elasticsearch reference of fielddata and something important is written there:
Before you enable fielddata, consider why you are using a text field for aggregations, sorting, or in a script. It usually doesn’t make sense to do so. [...]
Instead, you should have a text field for full text searches, and an unanalyzed keyword field with doc_values enabled for aggregations
All the fields of the filebeat index can be verified in Kibana's management of "Index Patterns".
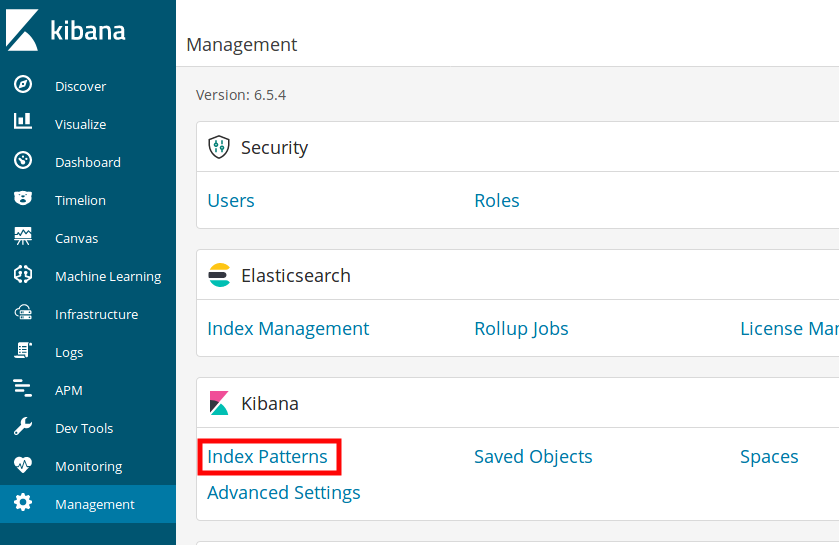
A total of 163 fields were discovered in the filebeat-* index patterns. The "clientip" text field was listed, too, however no clientip.keyword field. After a click on the "refresh field list" icon and a few seconds later 190 fields were shown. One of the new ones: clientip.keyword.
Back editing the visualization, the new field "clientip.keyword" was used instead of the "original text field" clientip:
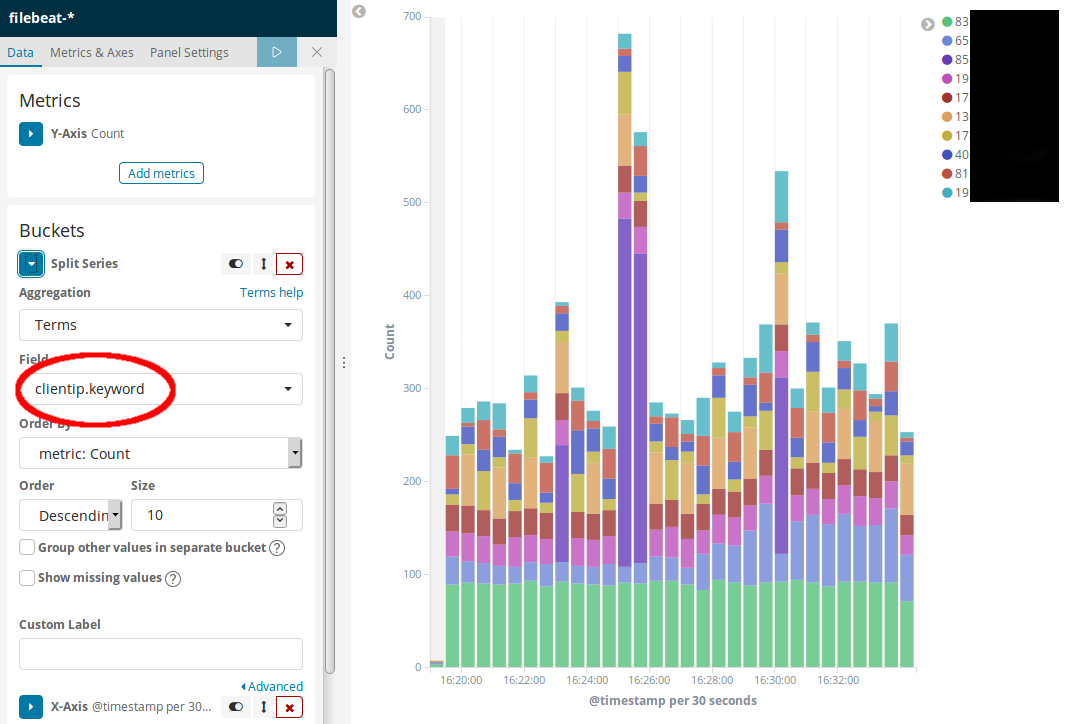
And finally the data is shown (again)!
The visualizations were created a while ago and were always working in the dashboard(s). But all of a sudden this error X of Y shards failed showed up in Kibana. But why would this all of a sudden happen?
Two recent modifications happened in this environment.
1: There was a recent update of Elasticsearch from 6.5 to 6.8.
2: The filebeat index template was updated with a new one, probably missing previously created mappings.
One of these modifications or possibly even both of them combined caused the keyword fields to be gone and the visualizations to break.