
Of course we cannot always share details about our work with customers, but nevertheless it is nice to show our technical achievements and share some of our implemented solutions.
A couple of weeks ago, on a quiet evening in the last days of February. The days were getting longer again, nature started to revive and our systems were humming and delivering content. Until tons of Icinga alerts disturbed the relaxing evening.
Alerts indicated that on our main website, all articles were down and instead a 404 error was delivered. This situation could happen when the article content application is completely down.
Our visual monitoring (using NagVis connected to Icinga 2) helped us to quickly identify which systems were impacted. After closer analysis on the "causing" article content application, it turned out that the application got very slow responses from an Elasticsearch cloud service which caused the application to timeout.
[es_rejected_execution_exception] rejected execution of org.elasticsearch.common.util.concurrent.TimedRunnable@61992906 on QueueResizingEsThreadPoolExecutor[name = instance-0000000004/search, queue capacity = 1000, min queue capacity = 1000, max queue capacity = 1000, frame size = 2000, targeted response rate = 1s, task execution EWMA = 71.2ms, adjustment amount = 50, org.elasticsearch.common.util.concurrent.QueueResizingEsThreadPoolExecutor@c3f9ba6[Running, pool size = 11, active threads = 11, queued tasks = 1738, completed tasks = 14193312431]]
The reason for the slow responses was found quickly: CPU of Elasticsearch was peaking.
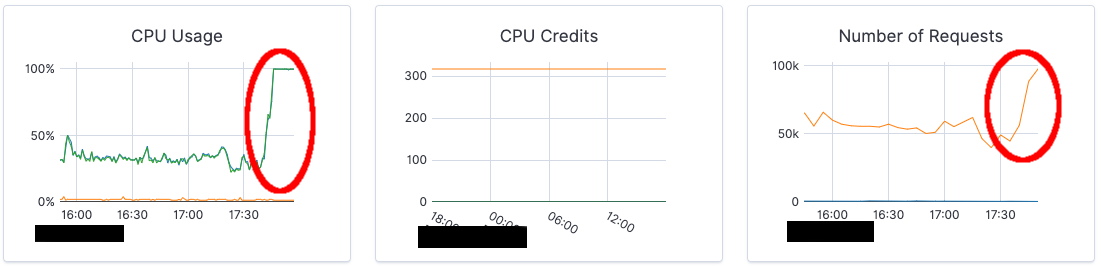
The reason for the peaks? An increased number of requests. Time to find out, where the requests were coming from.
The first suspicion was that we've became victim of a DDOS attack. But when we turned our heads towards our Kibana dashboard, which shows live statistics of requests on our front (Internet facing) systems, we immediately saw something out of the ordinary:
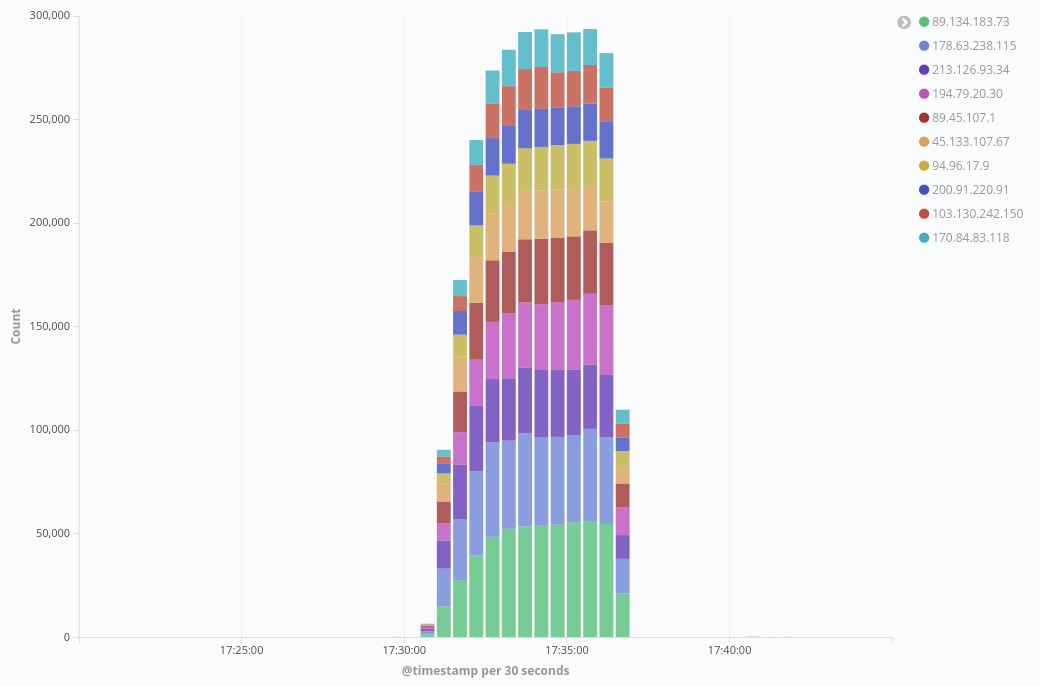
Just a bunch of single IP addresses caused a massive number of requests per second. Once we knew the target of the attack, we checked the logs and found out that all requests went to the same URL - but with added random parameters:
"GET /path?LGLXS=MMQXQMQPF HTTP/1.1" 503 0 "http://www.google.com/ETOMK" "Mozilla/4.0 (compatible; MSIE 8.0; Windows NT 5.1; Trident/4.0; SV1; .NET CLR 2.0.50727; InfoPath.2)"
"GET /path?MNXBU=ZLVM HTTP/1.1" 503 0 "http://www.google.com/LUSSXEE" "Mozilla/5.0 (X11; U; Linux x86_64; en-US; rv:1.9.1.3) Gecko/20090913 Firefox/3.5.3"
"GET /path?YXHSIN=YHGYDQXLP HTTP/1.1" 503 0 "http://www.google.com/?q=OZDBK" "Mozilla/5.0 (Windows; U; MSIE 7.0; Windows NT 6.0; en-US)"
"GET /path?YOUCA=KSWXICO HTTP/1.1" 503 0 "http://www.google.com/?q=KKLROU" "Opera/9.80 (Windows NT 5.2; U; ru) Presto/2.5.22 Version/10.51"
"GET /path?IBZOVWW=RRX HTTP/1.1" 503 0 "http://www.google.com/?q=XEPDZT" "Mozilla/4.0 (compatible; MSIE 8.0; Windows NT 5.2; Win64; x64; Trident/4.0)"
"GET /path?YODSCYORSI=MXCJUKHIW HTTP/1.1" 503 0 "http://www.usatoday.com/search/results?q=IGZOPHF" "Mozilla/5.0 (Windows; U; Windows NT 5.2; en-US; rv:1.9.1.3) Gecko/20090824 Firefox/3.5.3 (.NET CLR 3.5.30729)"
"GET /path?NNM=DEBQCAWR HTTP/1.1" 503 0 "http://engadget.search.aol.com/search?q=ZTOZRYAB" "Mozilla/4.0 (compatible; MSIE 8.0; Windows NT 6.0; Trident/4.0; SLCC1; .NET CLR 2.0.50727; .NET CLR 1.1.4322; .NET CLR 3.5.30729; .NET CLR 3.0.30729)"
By using these GET parameters, our Varnish cache interpreted the request as a new URL and wanted to create a new cache object, therefore passing the request to the backend - for all these requests - and sending a response header X-Cache: MISS. The backend needed to get data from Elasticsearch from each request causing Elasticsearch's CPU to spike and the backend application to timeout. Causing all systems using this backend to slowly but surely fail.
We started to block the source IP addresses on our firewalls. But as soon as we did, the attacker simply switched to yet another source IP address. This, and the fact that this particular path was used, was the moment we realized, this is an attacker who was deliberately attacking our systems, not just an automated bot attack.
At this time we knew we needed to do something in Varnish to strip these GET parameters from the requested URL and serve content from cache. Varnish should be able to cope even with such high numbers of requests. But we needed a couple of minutes for research, VCL change and Varnish deployment. While developers were looking into the VCL change, us Ops were out to stall the attacker. To give us some time and help get the systems back online, we added a simple empty response for the attacked path:
location /path {
return 202; # Attack workaround
}
While the attacker still continued the attack, it did not have any effect on the backend anymore. That gave Elasticsearch and all the applications using ES and the attacked backend a break to recover and slowly start showing contents again.
After a couple of minutes the developers came up with an idea to "strip GET parameters" from the URL, using regsub:
if (req.url ~ "^/path") {
set req.url = regsub(req.url, "/path?.*", "/path");
}
This VCL was quickly deployed to our TEST environment and successfully tested and then immediately pushed to our PROD environment. Once the VCL was deployed to PROD, it was time to remove the attack workaround and see whether Varnish would be able to cope with the large amount of requests.
The moment of truth arrived. VCL deployed, Varnish reloaded, workaround removed. The attacker continued the attacks which now went to Varnish (again) but this time all the parameters in the URL did not matter anymore - Varnish served the same content and returned a response header X-Cache: HIT for each response. We followed the requests arriving in Varnish using varnishlog showing the requested URL from the client (first ReqURL), the requested URL to the backend (second ReqURL) and the X-Cache header in the final HTTP resonse:
- ReqURL /path/?EOKKGJ=HOLXGHVRNX
- ReqURL /path/
- RespHeader X-Cache: HIT
- ReqURL /path/?THBMLRHLU=WNSYNI
- ReqURL /path/
- RespHeader X-Cache: HIT
- ReqURL /path/?WKONBZC=NDEPO
- ReqURL /path/
- RespHeader X-Cache: HIT
- ReqURL /path/?VMQL=YPUGDH
- ReqURL /path/
- RespHeader X-Cache: HIT
- ReqURL /path/?TQYLWLHNCW=QOJIZ
- ReqURL /path/
- RespHeader X-Cache: HIT
- ReqURL /path/?ATZPMU=ECELWW
- ReqURL /path/
- RespHeader X-Cache: HIT
- ReqURL /path/?ORQ=LGGGCWDR
- ReqURL /path/
- RespHeader X-Cache: HIT
- ReqURL /path/?ZEUCCSYX=SABWTWKPV
- ReqURL /path/
- RespHeader X-Cache: HIT
- ReqURL /path/?HFVM=YXPGRBBGB
- ReqURL /path/
- RespHeader X-Cache: HIT
- ReqURL /path/?CZCEGECSSV=UQMWTXYZ
- ReqURL /path/
- RespHeader X-Cache: HIT
As soon as this solution was in place, it only took a couple of minutes until the attacks stopped. Which gave us a final conclusion: The attacker knew what part and in which way our application could be attacked and deliberately launched the attack from a couple of IP addresses which the attacker seemed to rotate once we blocked them. The fact that the attacks stopped as soon as we deployed a fix on Varnish, means the attacker was monitoring the attacks and stopped them as soon as the response header X-Cache changed from MISS to HIT. Which also means: Showing the X-Cache header information is not only helpful for us to troubleshoot the application, it is also a security risk. It shows to potential attackers which parts of the application might be attack-able with a DOS attack.
From this particular and very targeted attack we learned that showing the X-Cache header publicly is a security risk and we've recently removed this header response from all business critical applications. We also learned that Varnish creates a new cache object for each slightly different URL when parameters are added and that we can use regsub to properly trim the parameters from the requested URL's - wherever it is possible. It not only helps to prevent such attacks, it also helps Varnish to be much more performant by using a single cache object in memory for the same URL. We've also adjusted our application health checks that Varnish identifies quicker that a backend is down and starts delivering content from cache.