
Of course we cannot always share details about our work with customers, but nevertheless it is nice to show our technical achievements and share some of our implemented solutions.
A couple of weeks ago, we needed to investigate a non-responding Apache web server (which serves as a reverse proxy in front of a Tomcat) on a Ubuntu Xenial (16.04) machine. Monitoring checks revealed that the application in Tomcat was still running fine, but requests through Apache timed out.
A quick view into Apache's error log showed many lines, containing the following content:
[Mon Feb 03 09:20:29.950561 2020] [mpm_event:error] [pid 5587:tid 139748587677568] AH00485: scoreboard is full, not at MaxRequestWorkers
[Mon Feb 03 09:20:30.951661 2020] [mpm_event:error] [pid 5587:tid 139748587677568] AH00485: scoreboard is full, not at MaxRequestWorkers
[Mon Feb 03 09:20:31.952739 2020] [mpm_event:error] [pid 5587:tid 139748587677568] AH00485: scoreboard is full, not at MaxRequestWorkers
[Mon Feb 03 09:20:32.953828 2020] [mpm_event:error] [pid 5587:tid 139748587677568] AH00485: scoreboard is full, not at MaxRequestWorkers
[Mon Feb 03 09:20:33.954911 2020] [mpm_event:error] [pid 5587:tid 139748587677568] AH00485: scoreboard is full, not at MaxRequestWorkers
[Mon Feb 03 09:20:34.955977 2020] [mpm_event:error] [pid 5587:tid 139748587677568] AH00485: scoreboard is full, not at MaxRequestWorkers
[Mon Feb 03 09:20:35.957051 2020] [mpm_event:error] [pid 5587:tid 139748587677568] AH00485: scoreboard is full, not at MaxRequestWorkers
[Mon Feb 03 09:20:36.957745 2020] [mpm_event:error] [pid 5587:tid 139748587677568] AH00485: scoreboard is full, not at MaxRequestWorkers
[Mon Feb 03 09:20:37.958814 2020] [mpm_event:error] [pid 5587:tid 139748587677568] AH00485: scoreboard is full, not at MaxRequestWorkers
[Mon Feb 03 09:20:38.959883 2020] [mpm_event:error] [pid 5587:tid 139748587677568] AH00485: scoreboard is full, not at MaxRequestWorkers
[Mon Feb 03 09:20:39.960967 2020] [mpm_event:error] [pid 5587:tid 139748587677568] AH00485: scoreboard is full, not at MaxRequestWorkers
Research led to Apache bug 53555 which occurs in the event mpm. According to the bug description, this was fixed in Apache 2.4.25. Ubuntu Xenial however still ships Apache 2.4.18 with a couple of backported patches.
So is the source of the problem really the Apache bug mentioned above or something else? This can be validated by letting this Apache with mpm event run for a couple of days and measure the states of the Apache threads.
After a clean start of Apache, it's server status page (scoreboard) looks nice and clean:
root@apache:~# lynx localhost/server-status
Server Version: Apache/2.4.18 (Ubuntu) mod_jk/1.2.41 OpenSSL/1.0.2g
Server MPM: event
Server Built: 2016-07-14T12:32:26
_____________________________________________________________
Current Time: Monday, 03-Feb-2020 12:30:13 CET
Restart Time: Monday, 03-Feb-2020 09:20:48 CET
Parent Server Config. Generation: 1
Parent Server MPM Generation: 0
Server uptime: 3 hours 9 minutes 24 seconds
Server load: 0.00 0.00 0.00
Total accesses: 16863 - Total Traffic: 196.8 MB
CPU Usage: u10.61 s8.26 cu0 cs0 - .166% CPU load
1.48 requests/sec - 17.7 kB/second - 11.9 kB/request
1 requests currently being processed, 49 idle workers
PID Connections Threads Async connections
total accepting busy idle writing keep-alive closing
31339 0 yes 0 25 0 0 0
31340 0 yes 1 24 0 0 0
Sum 0 1 49 0 0 0
_________________________________________________W..............
................................................................
......................
Scoreboard Key:
"_" Waiting for Connection, "S" Starting up, "R" Reading Request,
"W" Sending Reply, "K" Keepalive (read), "D" DNS Lookup,
"C" Closing connection, "L" Logging, "G" Gracefully finishing,
"I" Idle cleanup of worker, "." Open slot with no current process
But already one day later, after the daily log rotation ran and caused a graceful Apache restart (reload), the scoreboard looks quite different:
root@apache:~# lynx localhost/server-status
Server Version: Apache/2.4.18 (Ubuntu) mod_jk/1.2.41 OpenSSL/1.0.2g
Server MPM: event
Server Built: 2016-07-14T12:32:26
_____________________________________________________________
Current Time: Tuesday, 04-Feb-2020 17:19:28 CET
Restart Time: Monday, 03-Feb-2020 09:20:48 CET
Parent Server Config. Generation: 2
Parent Server MPM Generation: 1
Server uptime: 1 day 7 hours 58 minutes 39 seconds
Server load: 0.00 0.00 0.00
Total accesses: 59027 - Total Traffic: 1.7 GB
CPU Usage: u175.56 s424.83 cu0 cs0 - .522% CPU load
.513 requests/sec - 15.7 kB/second - 30.6 kB/request
1 requests currently being processed, 49 idle workers
PID Connections Threads Async connections
total accepting busy idle writing keep-alive closing
31339 1 no 0 0 0 0 0
31340 1 no 0 0 0 0 0
21534 0 yes 0 25 0 0 0
21535 0 yes 1 24 0 0 0
Sum 2 1 49 0 0 0
GGGGGGGGGGGGGGGGGGGGGGGGGGGGGGGGGGGGGGGGGGGGGGGGGG______________
__________________________________W_............................
......................
Scoreboard Key:
"_" Waiting for Connection, "S" Starting up, "R" Reading Request,
"W" Sending Reply, "K" Keepalive (read), "D" DNS Lookup,
"C" Closing connection, "L" Logging, "G" Gracefully finishing,
"I" Idle cleanup of worker, "." Open slot with no current process
A lot of G (Gracefully finishing) states were stil llisted in the scoreboard. Such a graceful finish should happen during (max) a few seconds - they should not "hang around" like this. This is exactly what the mentioned Apache bug does: It freezes up the "cleanup" of these threads.
Using the monitoring plugin check_apachestatus, it is possible to read Apache's server status scoreboard and automatically create graphs from the performance data. Example:
ck@apache:~$ /usr/lib/nagios/plugins/check_apachestatus.pl -H localhost -w 5 -c 1
OK 0.046013 seconds response time. Idle 48, busy 2, open slots 50 | 'Waiting for Connection'=48 'Starting Up'=0 'Reading Request'=0 'Sending Reply'=2 'Keepalive (read)'=0 'DNS Lookup'=0 'Closing Connection'=0 'Logging'=0 'Gracefully finishing'=50 'Idle cleanup'=0 'Open slot'=50 'Requests/sec'=0.5 'kB per sec'=15.7KB 'kB per Request'=30.6KB
This monitoring check was added and, as expected, the number of threads/slots being in state G (Gracefully finishing) increased:
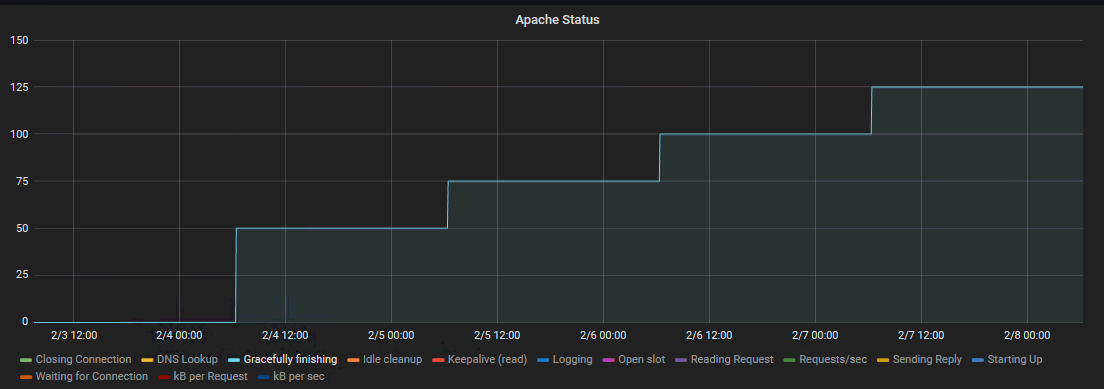
At the 4th day, all the Apache slots were fully used and in G state. Apache completely froze and not even the server status could be shown anymore:
ck@apache:~$ curl localhost/server-status -m 30
curl: (28) Operation timed out after 30000 milliseconds with 0 bytes received
This situation could be verified a couple of times. Every time all the Apache slots were fully used, Apache's processes needed to be killed, followed by a new start of Apache, to get Apache working again.
As of this writing (April 2020), this bug still affects Apache installations on Ubuntu Xenial. But as this bug only affects the mpm event module, another mpm module should not be affected by it. Actually a switch to mpm prefork (which is the default mpm by the way) is probably the fastest "workaround" to solve this problem:
root@apache:~# systemctl stop apache2
root@apache:~# a2dismod mpm_event
root@apache:~# a2enmod mpm_prefork
root@apache:~# apache2ctl configtest
Syntax OK
root@apache:~# service apache2 restart
A server-status check confirms that mpm prefork is now being used:
root@apache:~# lynx localhost/server-status
Server Version: Apache/2.4.18 (Ubuntu) mod_jk/1.2.41 OpenSSL/1.0.2g
Server MPM: prefork
Server Built: 2016-07-14T12:32:26
_____________________________________________________________
Current Time: Monday, 24-Feb-2020 17:29:01 CET
Restart Time: Monday, 24-Feb-2020 17:04:32 CET
Parent Server Config. Generation: 1
Parent Server MPM Generation: 0
Server uptime: 24 minutes 29 seconds
Server load: 0.01 0.04 0.01
Total accesses: 3206 - Total Traffic: 167.3 MB
CPU Usage: u2.21 s1.45 cu0 cs0 - .249% CPU load
2.18 requests/sec - 116.6 kB/second - 53.4 kB/request
2 requests currently being processed, 9 idle workers
_W_.___._...__...W._............................................
................................................................
......................
After the change, the application (running in Tomcat, reverse proxied through this Apache) was tested and no difference between MPM event and MPM prefork could be seen. How would mpm prefork's log rotation have an effect on the Apache slots? This graph speaks for itself:
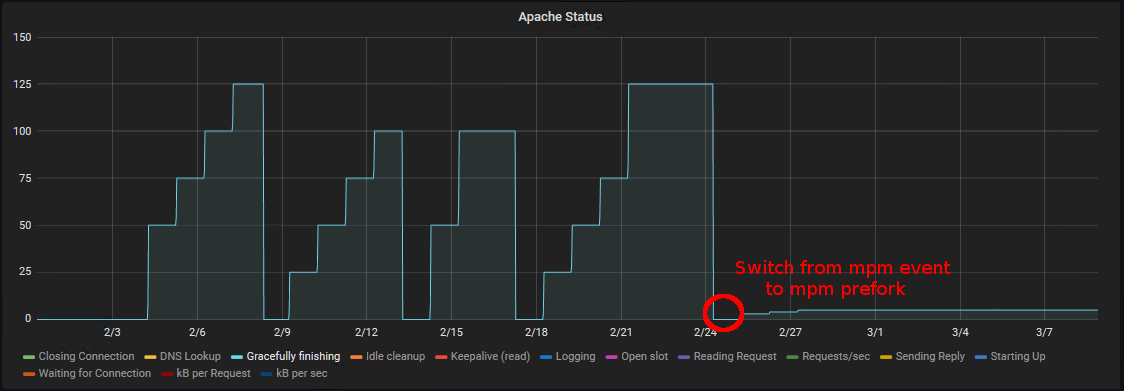
In the first few days, the numbers of slots being in state G slightly increased but then remained at a steady value.