
Of course we cannot always share details about our work with customers, but nevertheless it is nice to show our technical achievements and share some of our implemented solutions.
HP Proliant servers allow remote monitoring and integration into monitoring software, such as Nagios, Icinga or Naemon, using a couple of ways:
For many years we've been using the monitoring plugin check_ilo2_health which makes use of the second method. This allows us to get a quick oversight in case hardware problems are detected.
Update 2026: You might want to consider check_ilorest, which is a modern hybrid monitoring plugin. It supports integration into classic monitoring tools, such as Nagios or Icinga, but can also be run and integrated into metrics based (Prometheus) observability. check_ilorest is available since autumn 2025 and checks the Hardware Health of modern HPE servers, including usage metrics such as power usage.
Note: For storage drives (hard drives or solid state drives) relying only on check_ilo2_health is not a wise idea. Read the article "Multiple ways to monitor physical hard drives with very different results" to find out why.
check_ilo2_health also outputs helpful performance data, if enabled using -d / --perfdata parameters. By parsing this performance data, historical graphs can be created. However the plugin mainly showed performance data for the different temperature sensors.
$ /usr/lib/nagios/plugins/check_ilo2_health.pl -H iloip -u admin -p pass -3 -c -o -a -d
ILO2_HEALTH OK - (Board-Version: ILO>=3) Temperatures: Temp_1 (OK): 26, Temp_2 (OK): 40, Temp_3 (OK): 40, Temp_4 (OK): 39, Temp_5 (OK): 39, Temp_6 (OK): 43, Temp_7 (OK): 42, Temp_8 (OK): 51, Temp_9 (OK): 45, Temp_10 (OK): 52, Temp_11 (OK): 43, Temp_12 (OK): 51, Temp_19 (OK): 29, Temp_20 (OK): 37, Temp_21 (OK): 37, Temp_22 (OK): 35, Temp_23 (OK): 46, Temp_24 (OK): 42, Temp_25 (OK): 41, Temp_26 (OK): 42, Temp_29 (OK): 35, Temp_30 (OK): 77 | Temp_1=26;41;45 Temp_2=40;82;83 Temp_3=40;82;83 Temp_4=39;87;92 Temp_5=39;87;92 Temp_6=43;87;92 Temp_7=42;87;92 Temp_8=51;90;95 Temp_9=45;65;70 Temp_10=52;90;95 Temp_11=43;70;75 Temp_12=51;90;95 Temp_19=29;70;75 Temp_20=37;70;75 Temp_21=37;80;85 Temp_22=35;80;85 Temp_23=46;77;82 Temp_24=42;70;75 Temp_25=41;70;75 Temp_26=42;70;75 Temp_29=35;60;65 Temp_30=77;110;115
Wouldn't it be nice to also read the current power consumption of the server?
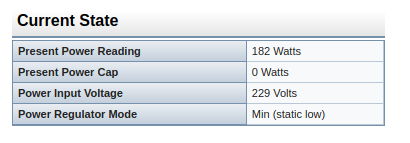
The good news is, that ILO's XML output also contains the current power consumption/usage of the server. It represents the same value as seen in ILO's user interface in the Power Meter (Present Power Reading).
The XML export can be seen by applying the -v parameter three times to the plugin:
$ /usr/lib/nagios/plugins/check_ilo2_health.pl -H iloip -u admin -p pass -3 -c -o -a -d -v -v -v
[...]
<POWER_SUPPLIES>
<POWER_SUPPLY_SUMMARY>
<PRESENT_POWER_READING VALUE = "182 Watts"/>
<POWER_MANAGEMENT_CONTROLLER_FIRMWARE_VERSION VALUE = "1.6"/>
<HIGH_EFFICIENCY_MODE VALUE = "Balanced"/>
</POWER_SUPPLY_SUMMARY>
<SUPPLY>
<LABEL VALUE = "Power Supply 1"/>
<STATUS VALUE = "OK"/>
chunk: 003
chunk size: 3
</SUPPLY>
Head:
chunk: 1ff
chunk size: 511
<SUPPLY>
<LABEL VALUE = "Power Supply 2"/>
<STATUS VALUE = "OK"/>
</SUPPLY>
</POWER_SUPPLIES>
[...]
As check_ilo2_health uses Perl's SimpleXML module to read data from the output, we adjusted the plugin to read the value of this XML field (PRESENT_POWER_READING):
my $powerusage=$xml->{'POWER_SUPPLIES'}[0]->{'POWER_SUPPLY_SUMMARY'}[0]->{'PRESENT_POWER_READING'}[0]->{'VALUE'};
To make this more user-friendly, we contributed to the plugin (created and maintained by Alexander Greiner-Baer) and added new options: -W / --powerusage. Using either one of these parameters will tell the plugin to output the server's current power usage (in Watt):
$ /usr/lib/nagios/plugins/check_ilo2_health.pl -H iloip -u admin -p pass -3 -c -o -a -W
ILO2_HEALTH OK - (Board-Version: ILO>=3) Power Usage: 176 Watts, Temperatures: Temp_1 (OK): 26, Temp_2 (OK): 40, Temp_3 (OK): 40, Temp_4 (OK): 39, Temp_5 (OK): 40, Temp_6 (OK): 44, Temp_7 (OK): 43, Temp_8 (OK): 51, Temp_9 (OK): 45, Temp_10 (OK): 52, Temp_11 (OK): 43, Temp_12 (OK): 51, Temp_19 (OK): 29, Temp_20 (OK): 37, Temp_21 (OK): 37, Temp_22 (OK): 36, Temp_23 (OK): 46, Temp_24 (OK): 42, Temp_25 (OK): 41, Temp_26 (OK): 42, Temp_29 (OK): 35, Temp_30 (OK): 77
In combination with -d / --perfdata, the power usage is also added to the performance data:
$ /usr/lib/nagios/plugins/check_ilo2_health.pl -H iloip -u admin -p pass -3 -c -o -a -W -d
ILO2_HEALTH OK - (Board-Version: ILO>=3) Power Usage: 166 Watts, Temperatures: Temp_1 (OK): 26, Temp_2 (OK): 40, Temp_3 (OK): 40, Temp_4 (OK): 39, Temp_5 (OK): 40, Temp_6 (OK): 44, Temp_7 (OK): 42, Temp_8 (OK): 51, Temp_9 (OK): 45, Temp_10 (OK): 53, Temp_11 (OK): 43, Temp_12 (OK): 51, Temp_19 (OK): 29, Temp_20 (OK): 37, Temp_21 (OK): 37, Temp_22 (OK): 35, Temp_23 (OK): 46, Temp_24 (OK): 42, Temp_25 (OK): 41, Temp_26 (OK): 42, Temp_29 (OK): 35, Temp_30 (OK): 76 | power=166;; Temp_1=26;41;45 Temp_2=40;82;83 Temp_3=40;82;83 Temp_4=39;87;92 Temp_5=40;87;92 Temp_6=44;87;92 Temp_7=42;87;92 Temp_8=51;90;95 Temp_9=45;65;70 Temp_10=53;90;95 Temp_11=43;70;75 Temp_12=51;90;95 Temp_19=29;70;75 Temp_20=37;70;75 Temp_21=37;80;85 Temp_22=35;80;85 Temp_23=46;77;82 Temp_24=42;70;75 Temp_25=41;70;75 Temp_26=42;70;75 Temp_29=35;60;65 Temp_30=76;110;115
Our contribution to the code was accepted by Alexander and is available in check_ilo2_health version 1.66, which was already released on Nagios Exchange.
As we are writing this article, there is no public code repository available yet, our own repository was used to document the changes between version 1.65 and 1.66. As soon as an official public repository for the plugin is available, we will update this article.
The main purpose of this added power consumption monitoring is to create historical graphs to see the power consumption over time. In our Icinga 2 monitoring, the plugin's performance data is read and entered into an InfluxDB time series database. This data is read by Grafana and voilà - historical graphs of the server's power consumption are at your service:
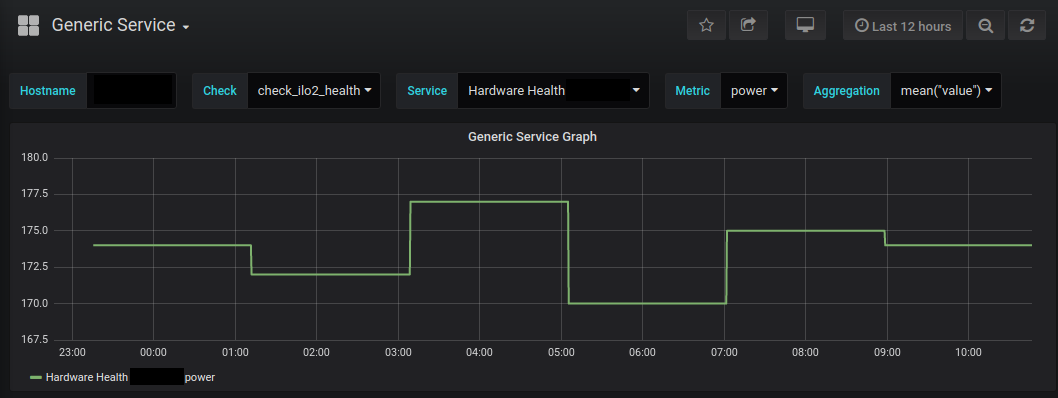
In our case we run check_ilo2_health every 2 hours as a regular hardware check. You can see this in the way the values change in a "jumpy" way. For more fine tuning you could run the plugin more often.