
Of course we cannot always share details about our work with customers, but nevertheless it is nice to show our technical achievements and share some of our implemented solutions.
OpenManage is a helpful application which we use for monitoring of physical Dell servers. In combination with the check_openmanage monitoring plugin, this allows deep hardware monitoring and integration into a monitoring software, such as Icinga. When using Ubuntu Linux as Operating System, OpenManage can be installed by using the APT repositories managed by Dell.
The OpenManage check on a particular server (Dell PowerEdge R7525) was triggered and reported a defective hardware.

A quick verification on the server itself confirms the alert:
ck@ubuntu:~$ /usr/lib/nagios/plugins/check_openmanage
Enclosure 0:0:1 [Backplane] on controller 0 is Failed
By using the check_openmanage plugin with the --debug parameter, the hardware details of this server can be seen:
ck@ubuntu:~$ /usr/lib/nagios/plugins/check_openmanage --debug
System: PowerEdge R7525 OMSA version: 10.0.1
ServiceTag: XXXXXXX Plugin version: 3.7.12
BIOS/date: 1.7.3 10/05/2020 Checking mode: local
-----------------------------------------------------------------------------
Storage Components
=============================================================================
STATE | ID | MESSAGE TEXT
---------+----------+--------------------------------------------------------
OK | 0 | Controller 0 [PERC H745 Front] is Ready
OK | 0:0:1:0 | Physical Disk 0:1:0 [SATA-SSD 960GB] on ctrl 0 is Online
OK | 0:0:1:1 | Physical Disk 0:1:1 [SATA-SSD 960GB] on ctrl 0 is Online
OK | 0:0:1:2 | Physical Disk 0:1:2 [SATA-SSD 960GB] on ctrl 0 is Ready (Global HS)
OK | 0:0 | Logical Drive '/dev/sda' [RAID-1, 893.75 GB] is Ready
OK | 0:0 | Cache Battery 0 in controller 0 is Ready
OK | 0:0 | Logical Connector [SAS Port RAID Mode] on controller 0 is Ready
CRITICAL | 0:0:1 | Enclosure 0:0:1 [Backplane] on controller 0 is Failed
-----------------------------------------------------------------------------
Chassis Components
=============================================================================
STATE | ID | MESSAGE TEXT
---------+------+------------------------------------------------------------
OK | 0 | Memory module 0 [A1, 32768 MB] is Ok
OK | 1 | Memory module 1 [A2, 32768 MB] is Ok
[...]
The Enclosure Backplane of the storage controller indeed shows that it is failed.
Wait a minute. The backplane?
But this alert got even more confusing. To double-check the alert, we logged into iDRAC and checked for hardware alerts. No current hardware alerts or warnings were shown, however in the "lifecycle events" table a couple of events showed up, which basically report the same error:
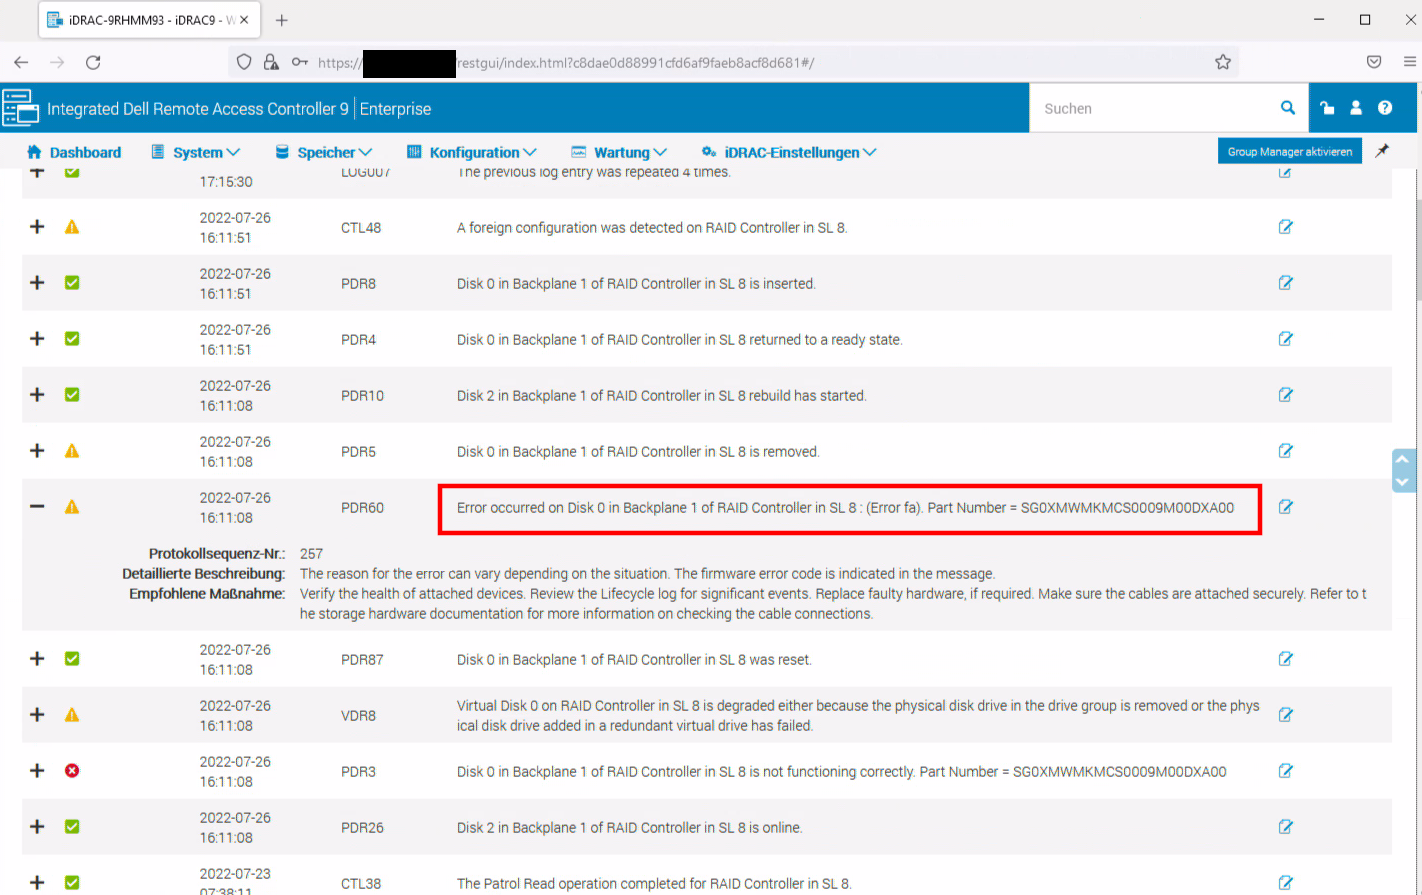
Error occurred on Disk 0 in Backplane 1 of RAID Controller in SL 8
It all seemed to start with an alert on Disk 0 at 16:11:08 local time. But a couple of seconds later (16:11:51) the disk returned to green again.
By looking at these logs and trying to make sense of it, it seems that someone was in the data center, took out disk 0 and re-inserted it back a few seconds later. The data center peeps however assured me that nobody touched that server.
If that is true and no human touched the Dell server, the alert seems to be a hiccup in the system which an auto-correction kicking in. That's also a possibility, however such cases are rarely reported and even less documented.
Since the alert was cleared in iDRAC, why does the hardware alert still show up in OpenManage?
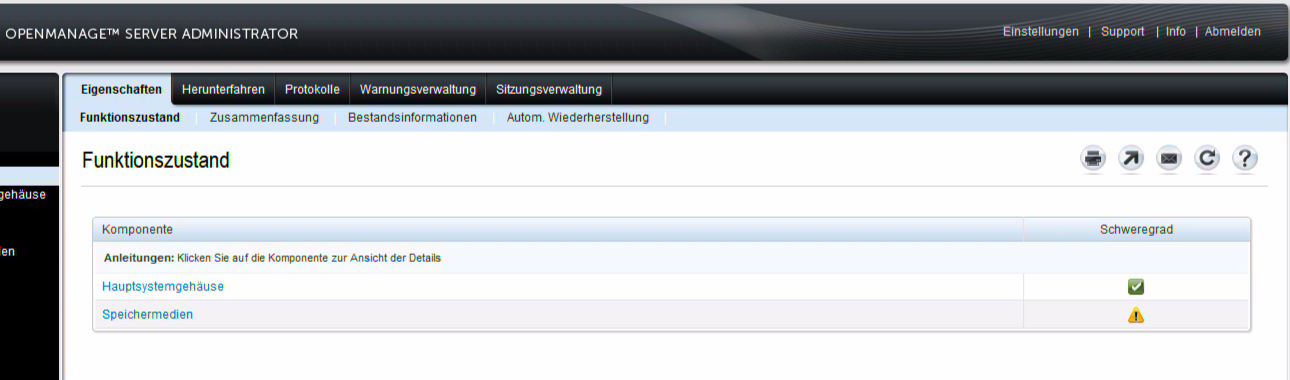
Time to log into the OpenManage Web User Interface, which is by default listening on port tcp/1311 on the server's current IP. As this Dell server runs a Linux OS, the root account can be used to log into the User Interface.
And here we can indeed see a warning icon showing up:
Following down the hardware links, shows the PERC H745 controller with a warning...
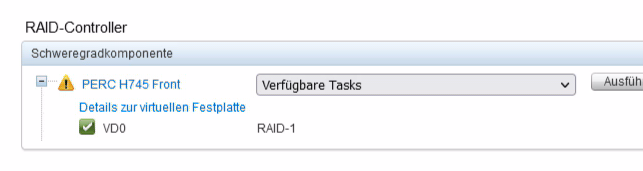
... followed by the logical connector...
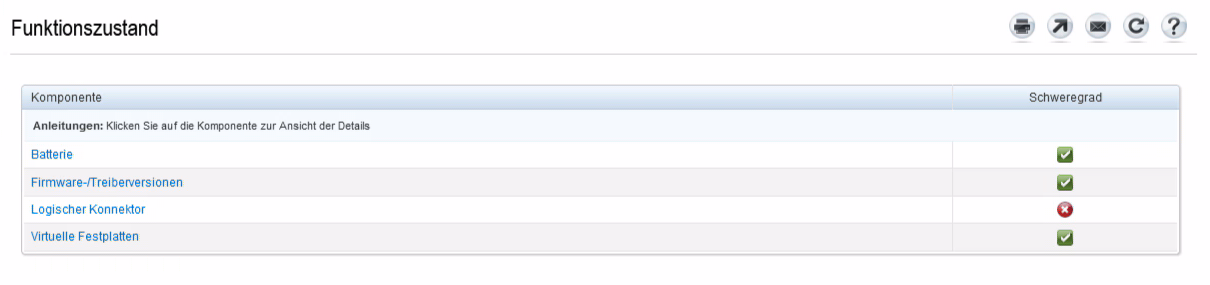
... and finally the enclosure (backplane):
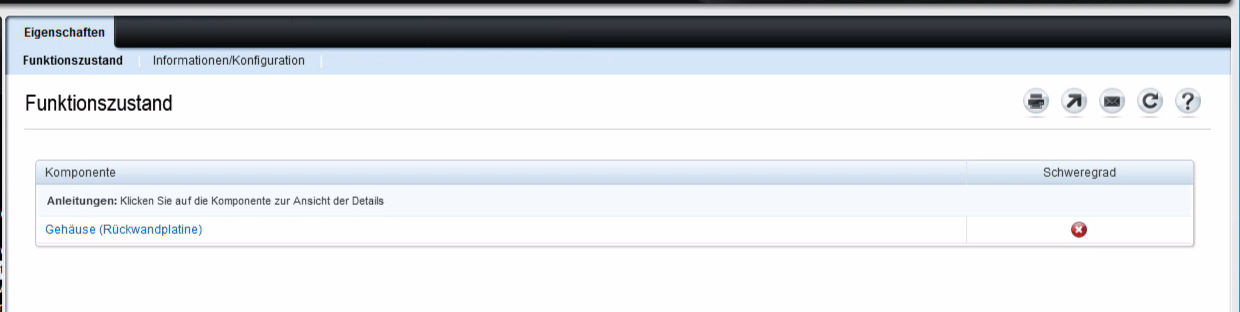
Here we got the visual verification - from the same we've already seen on the command line using check_openmanage.
But we still don't know what this means!
Researching the error itself and the events seen in iDRAC led to this and this post in the Dell community forums. Both threads basically say the problem is not the hardware, it's the server's firmware being out of date. Huh?! Excuse me?
If the controller gets too far out of date it will actually start listing the array as degraded
OK, that's good to know. However why would the alert be triggered all of a sudden, without any change?
After additional research, we came across a blog post from Thomas Chester about a degraded backplane error. Although Thomas was using a Windows server at the time of writing the article, the symptoms seemed to be the same as in our situation (a temporary error not being cleared). The solution:
The solution is to simply restart the Dell OpenManage Windows services.
OK, let's give this a try, but the Linux way:
root@ubuntu:~# systemctl restart dsm_sa_datamgrd.service
root@ubuntu:~# systemctl status dsm_sa_datamgrd.service
dsm_sa_datamgrd.service - Systems Management Data Engine
Loaded: loaded (/etc/systemd/system/dsm_sa_datamgrd.service; enabled; vendor preset: enabled)
Active: active (running) since Wed 2022-07-27 09:34:35 CEST; 18s ago
Process: 337763 ExecStart=/opt/dell/srvadmin/sbin/dsm_sa_datamgrd (code=exited, status=0/SUCCESS)
Main PID: 337773 (dsm_sa_datamgrd)
Tasks: 17 (limit: 154124)
Memory: 38.3M
CGroup: /system.slice/dsm_sa_datamgrd.service
|-337773 /opt/dell/srvadmin/sbin/dsm_sa_datamgrd
|-340459 /opt/dell/srvadmin/sbin/dsm_sa_datamgrd
Jul 27 09:34:23 ubuntu systemd[1]: Starting Systems Management Data Engine...
Jul 27 09:34:35 ubuntu systemd[1]: Started Systems Management Data Engine.
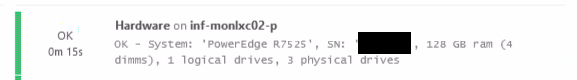
Once the OpenManage service was restarted, the check_openmanage monitoring plugin was run again. And the hardware error magically disappeared:
ck@ubuntu:~$ /usr/lib/nagios/plugins/check_openmanage
OK - System: 'PowerEdge R7525', SN: 'XXXXXXX', 128 GB ram (4 dimms), 1 logical drives, 3 physical drives
After forcing a re-check in Icinga, the Hardware service switched back to green in our monitoring as well:
When strange hardware errors appear on Dell servers, monitored using OpenManage Server Administrator, restart the OpenManage service first before further investigation. There might be some temporary (and self-corrected) error still hanging somewhere in the system (OpenManage cache?).