
Of course we cannot always share details about our work with customers, but nevertheless it is nice to show our technical achievements and share some of our implemented solutions.
A customer reached out that their Icingaweb2 UI no longer showed the embedded Grafana visualizations. To show Grafana panels directly inside the Icinga UI the "grafana" module must be installed. This module for icingaweb2 was initially developed and maintained by mikesch-p and then forked by Netways.
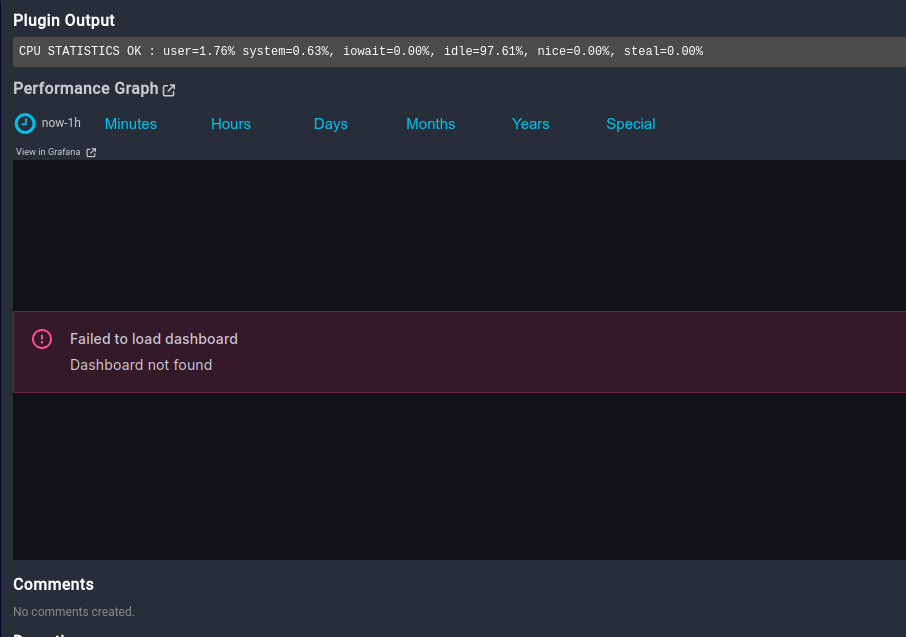
Although no change happened to the grafana module (using the Netways fork, v3.0.0), the embedded visualizations suddenly no longer showed any graphs/data. Instead the errors "Failed to load dashboard" and "Dashboard not found" showed up.
In the background, depending on the embedding method, the browser tries to directly communicate with Grafana on the dashboard API. The requested URL is https://grafana.example.com/graphs/api/dashboards/uid/XXXXXXXXX, where XXXXXXXXX is the dashboard UID configured in the Icingaweb2 grafana module.
Interestingly the response from Grafana was a 404 status with a JSON message: "Dashboard not found". That's the message showing up inside the Icinga UI as well.
Obviously the first verification should happen inside the grafana module configuration of the embedded graphs. Maybe the Grafana dashboard has changed or was even deleted?
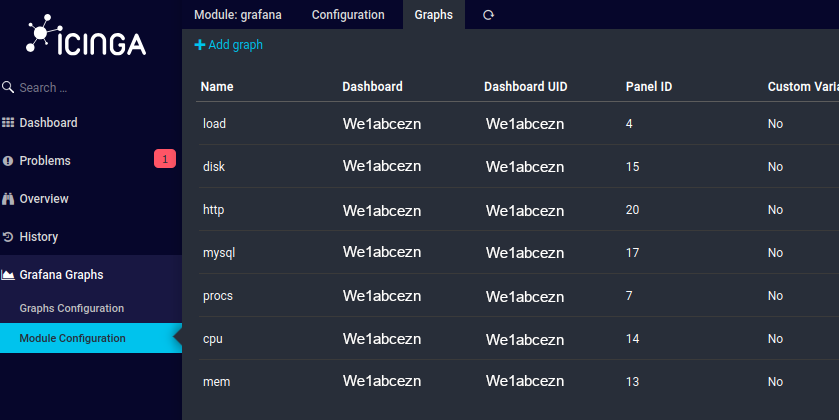
We can see the Dashboard UID is set to "We1abcezn".
By manually connecting to Grafana in the browser, the dashboard with the name "We1abcezn" indeed showed up. The dashboard loaded correctly in the browser, showing all visualizations (panels) nicely. However, at the second look, we noticed that the dashboard UID changed in the URL (address bar)!
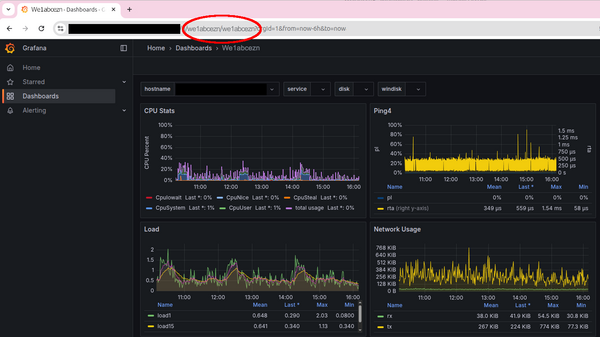
The dashboard UID inside the URL changed to lowercase letters, although Grafana still shows the dashboard UID with mixed upper and lower case letters. This definitely worked in the past and used the same UID with mixed upper and lower case letters in the URL before.
After adjusting the dashboard UID in the grafana module in Icinga's UI, the embedded graphs showed up correctly again.
Automatic updates on the Grafana server installed multiple updates in the previous weeks, which could be traced in the server's apt history logs:
Start-Date: 2025-05-06 06:20:22
Commandline: /usr/bin/unattended-upgrade
Upgrade: grafana:amd64 (11.6.1, 12.0.0)
--
Start-Date: 2025-05-22 06:53:25
Commandline: /usr/bin/unattended-upgrade
Upgrade: grafana:amd64 (12.0.0, 12.0.0-01)
--
Start-Date: 2025-05-23 07:15:13
Commandline: /usr/bin/unattended-upgrade -d
Upgrade: grafana:amd64 (12.0.0-01, 12.0.1)
The relevant entry here is the major upgrade from Grafana v11 to v12 on May 6th.
Grafana 12 introduced multiple breaking changes. One of these breaking changes is a more strict definition of dashboard UIDs on the API, which is most likely the cause of this issue.
We've identified and fixed the issue with the "failed to load dashboard" on the customer's Icinga2 installation fairly quickly and the customer was very happy about it.
If you run into Icinga2 problems, or need help or consulting in monitoring/observability topics in general, reach out to us.