
Of course we cannot always share details about our work with customers, but nevertheless it is nice to show our technical achievements and share some of our implemented solutions.
A while ago (November 2017) we already wrote about the monitoring plugin check_varnish.py (see article Monitoring multiple Varnish instances). Back then the problem was to use the plugin on multiple Varnish instances on the same server. These days a different problem had to be investigated.
Usually Varnish is very well behaved. It is fast, respects its memory limits and other resource or tuning based parameters. But, like a child, Varnish can sometimes misbehave. See the following memory consumption of a Varnish supposed to have a memory capacity of 20GB (-s malloc,20480M):
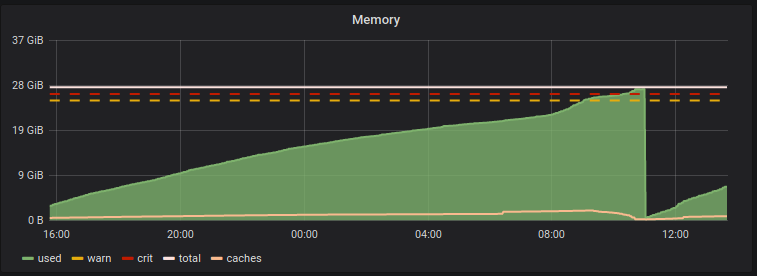
One can guess what happened: OOM and Varnish was killed. Not nice.
At the same time very high CPU usage was registered:
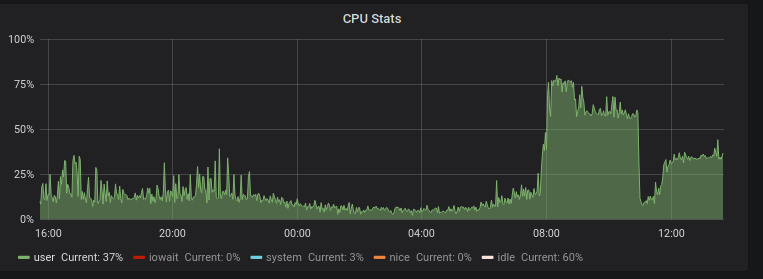
The big question arises: What is causing the resource spike leading to OOM. And why did Varnish not respect its 20GB memory cap?
Note: The problem was meanwhile found: It was a specific (non-cachable) URI causing problems in Varnish. What problems exactly? This is currently in research by Varnish Software.
varnishstat, besides varnishlog and varnishtop, is a very helpful command to identify problems in and around Varnish (meaning front and backend connections, analysing response codes, response times, etc). An older article (Analysing Varnish traffic with varnishtop and varnishlog) talks about these tools in more detail. By using varnishstat -1, the current counters of Varnish (or a selected Varnish instance using -n name) can be displayed:
# varnishstat -n varnish-name -1 | head
MGT.uptime 25902 1.00 Management process uptime
MGT.child_start 1 0.00 Child process started
MGT.child_exit 0 0.00 Child process normal exit
MGT.child_stop 0 0.00 Child process unexpected exit
MGT.child_died 0 0.00 Child process died (signal)
MGT.child_dump 0 0.00 Child process core dumped
MGT.child_panic 0 0.00 Child process panic
MAIN.summs 2352711 90.83 stat summ operations
MAIN.uptime 25903 1.00 Child process uptime
MAIN.sess_conn 502450 19.40 Sessions accepted
There are a lot of counters. In the current 6.0.5 version a total of 321 counters were found! Too much data can be overwhelming, but by picking out the right data, this can help enormously. After having used Varnish for multiple years, the following counters can be used to identify potential problems:
Note: Check out this very good article from the guys at Livingdocs for further information about relevant and important counters!
Continuous monitoring these (and other) counters over a longer period can show slowly rising problems.
Of course most of these counters were already monitored with the check_varnish.py plugin. However until today it was only possible to check a single counter:
root@varnish:~# ./check_varnish.py -n varnish-name -f MAIN.esi_errors
VARNISH OK - MAIN.esi_errors is 105787 | MAIN.esi_errors=105787;0;0;;
This unfortunately results in having to define one service check by counter we wanted to monitor. And it's not as dynamic as one would like.
With today's modification and pull request of the plugin, check_varnish.py now supports multiple fields:
root@varnish:~# ./check_varnish.py -n varnish-name -f MAIN.esi_errors,MAIN.sess_dropped,MAIN.n_lru_nuked,MAIN.cache_hit,MAIN.cache_miss
VARNISH OK - MAIN.esi_errors is 106491 - MAIN.sess_dropped is 0 - MAIN.n_lru_nuked is 87871 - MAIN.cache_hit is 247744 - MAIN.cache_miss is 254931 - | MAIN.esi_errors=106491;0;0;; MAIN.sess_dropped=0;0;0;; MAIN.n_lru_nuked=87871;0;0;; MAIN.cache_hit=247744;0;0;; MAIN.cache_miss=254931;0;0;;
The main purpose? Graphing. All the selected counters are shown as performance data and are automatically stored into an InfluxDB (or another timeseries/graphing database) via Icinga 2, and then displayed as graphs in Grafana.
The PR has already been merged and the code and modified monitoring plugin is available on the Github repository.
If you are using Varnish 6.5 or later, the output from varnishstat has slightly changed and caused a hiccup in check_varnish:
root@varnish:~# /usr/lib/nagios/plugins/check_varnish.py -f MAIN.n_lru_nuked,MAIN.cache_hit,MAIN.cache_miss
Traceback (most recent call last):
File "/usr/lib/nagios/plugins/check_varnish.py", line 158, in <module>
getopts()
File "/usr/lib/nagios/plugins/check_varnish.py", line 152, in getopts
varnishversion=int(args.arg_version.replace(".",""))
AttributeError: 'int' object has no attribute 'replace'
A fix for this has been submitted in Olivier's check_varnish repository. The adjusted plugin accepts an additional parameter -v or --version to enter the Varnish version used:
root@varnish:~# /usr/lib/nagios/plugins/check_varnish.py -f MAIN.n_lru_nuked,MAIN.cache_hit,MAIN.cache_miss -v 6.6.1
VARNISH OK - MAIN.n_lru_nuked is 0 - MAIN.cache_hit is 27343 - MAIN.cache_miss is 11485 - | MAIN.n_lru_nuked=0;0;0;; MAIN.cache_hit=27343;0;0;; MAIN.cache_miss=11485;0;0;;
Until the pull request is merged, you can get the updated check_varnish.py plugin here.
Please take a look at the next article: Icinga 2: Apply rule for monitoring multiple Varnish instances and create a Grafana Varnish dashboard.