
Of course we cannot always share details about our work with customers, but nevertheless it is nice to show our technical achievements and share some of our implemented solutions.
In the past 20 years we have moved from SSL to TLS (yet we're still talking about SSL certificates, funny isn't it). According to Wikipedia's Transport Layer Security page, this is the release history:
With TLS 1.0 deprecating this year, it's about time to (re-)adjust the TLS settings of web servers and proxies (if you are still allowing SSL protocols by 2020, shame on you). But the big question is: What will happen when TLS 1.0 is disabled in the configs? Will end-users get an error message? Will some API calls stop working?
Before adjusting the TLS configurations, it is wise to first collect data and see who/what is still accessing your web application with a deprecated security protocol.
Before going into details, let's first take a look at the data collection architecture. The following drawing should speak for itself:
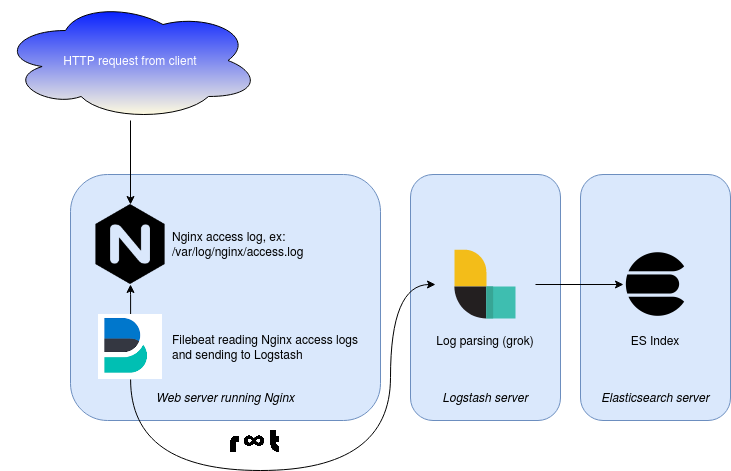
Basically Nginx logs the HTTP requests into its access logs. These logs are read by Filebeat and are continuously sent to a Logstash instance. In Logstash a grok parsing is happening (= splitting up the log line into fields) and the data is then stored into an Elasticsearch index.
The access_log parameter defines which log format should be used. By default, Nginx is using the "combined" log format for access logs. Meaning: When no specific log format was defined after the path to the log file, Nginx will use the combined log format:
server {
listen 443;
server_name myapp.example.com;
access_log /var/log/nginx/myapp.example.com.access.log;
error_log /var/log/nginx/myapp.example.com.error.log;
[...]
}
The combined log format logs http requests with the following data fields:
CLIENTIP IDENT USER [DATE, TIME, TIMEZONE] "REQUEST" STATUS SIZE "REFERRER" "USER-AGENT"
Example:
127.0.0.1 - - [27/Mar/2020:08:28:02 +0100] "GET /api/v1/status HTTP/1.1" 204 0 "https://anotherapp.example.com" "Mozilla/5.0 (iPhone; CPU iPhone OS 13_3_1 like Mac OS X) AppleWebKit/605.1.15 (KHTML, like Gecko) Version/13.0.5 Mobile/15E148 Safari/604.1"
Although the combined log format cannot be changed (Nginx would return a config error for duplicate combined log definition), an additional log format can be defined. The easiest way to do this is in the global configuration file /etc/nginx/nginx.conf in the http block:
http {
[...]
log_format log_with_tls_params '$remote_addr - $remote_user [$time_local] '
'"$request" $status $bytes_sent '
'"$http_referer" "$http_user_agent" '
'$ssl_protocol $ssl_cipher';
[...]
}
Here a new log format, named "log_with_tls_params", is defined. It follows the exact same structure as the "combined" log format but appends the log with two additional parameters: $ssl_protocol and $ssl_cipher (a full list of available variables can be found on alphabetical index of variables).
By defining this new log format right behind the path to the access log, Nginx is told to be using this custom log format:
server {
listen 443;
server_name myapp.example.com;
access_log /var/log/nginx/myapp.example.com.access.log log_with_tls_params;
error_log /var/log/nginx/myapp.example.com.error.log;
[...]
}
This results in a slightly different access log:
127.0.0.1 - - [27/Mar/2020:08:39:51 +0100] "GET /api/v1/panorama HTTP/1.1" 200 16758 "https://differentapp.example.com" "Mozilla/5.0 (Windows NT 10.0; Win64; x64; rv:74.0) Gecko/20100101 Firefox/74.0" TLSv1.2 ECDHE-RSA-AES256-GCM-SHA384
In this case, the HTTP client used TLS 1.2 protocol with ciphers ECDHE-RSA-AES256-GCM-SHA384.
The installation and configuration of Filebeat is not complex (see Install and configure Elastic Filebeat through Ansible for an example). Once Filebeat was installed, a simple configuration can be used to read all Nginx logs and ship to a Logstash server:
root@nginx01:~# cat /etc/filebeat/filebeat.yml
#=========================== Filebeat prospectors =============================
filebeat.prospectors:
# BEGIN -- Nginx logging configured by Ansible
- input_type: log
paths:
- /var/log/nginx/*.log
fields:
myapp: nginx
fields_under_root: true
# END -- Nginx logging configured by Ansible
#================================ General =====================================
# Shipper Name
name: nginx01
#================================ Outputs =====================================
# Logstash output
# BEGIN -- Logstash output configured by Ansible
output.logstash:
hosts: ["logstash.example.com:5044"]
# END -- Logstash output configured by Ansible
#================================ Logging =====================================
logging.level: debug
logging.selectors: [prospector, harvester]
The Nginx logs are added as a prospector. Important here: Filebeat is told to create an additional (meta) field called "myapp" with value "nginx". This will be used later in Logstash to separate different log types coming from Filebeat and apply specific filters.
As Logstash endpoint, logstash.example.com listening on port 5044 is defined.
The default log format (combined) is already known to Logstash as COMBINEDAPACHELOG (see grok-patterns):
COMMONAPACHELOG %{IPORHOST:clientip} %{USER:ident} %{USER:auth} \[%{HTTPDATE:timestamp}\] "(?:%{WORD:verb} %{NOTSPACE:request}(?: HTTP/%{NUMBER:httpversion})?|%{DATA:rawrequest})" %{NUMBER:response} (?:%{NUMBER:bytes}|-)
COMBINEDAPACHELOG %{COMMONAPACHELOG} %{QS:referrer} %{QS:useragent}
This means this grok simply needs to be adjusted for the two additional fields TLSversion and TLScipher. To make this more flexible, the fields can be made optional in the grok definition, using regular expression style "optional grouping":
COMBINEDAPACHELOG %{COMMONAPACHELOG} %{QS:referrer} %{QS:useragent}(?:(%{DATA:tlsversion})?)(?:(%{GREEDYDATA:tlscipher})?)
For the TLSversion field, the DATA grok type is used. For the TLScipher the GREEDYDATA type is used. Both fields are made optional using the question mark grouping (a regular expression style), allowing both default combined log formats and the custom log_with_tls_param format to be parsed by Logstash.
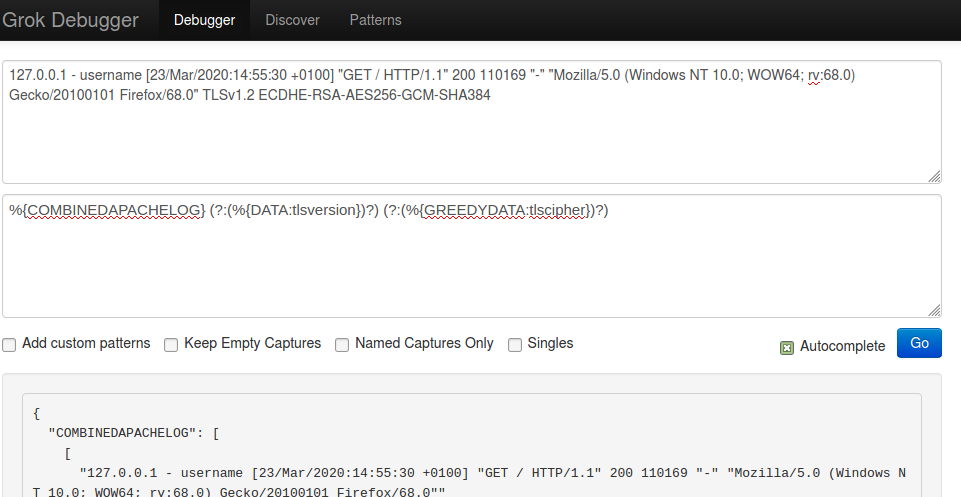
Pro tipp: To validate a grok filter before restarting Logstash, the website Grok Debugger is very helpful and gives also hints about patterns. If the grok contains an error, the json output is not shown and an errror (Compile ERROR) is shown instead. With the json output one is able to verify if the selected grok type is able to read the field's data correctly. For example: DATA for TLScipher would result in an empty tlscipher field. Only GREEDYDATA finally shows the value in the json output.
Now that the grok definition is adjusted for the two optional TLS fields, Logstash needs to be told when to apply this grok. This is the moment the additional (meta) field "myapp" comes into play:
root@logstash:~# cat /etc/logstash/conf.d/11-filter-nginx.conf
filter {
if [myapp] == "nginx" {
# Use Grok filter /usr/share/logstash/patterns/nginx
grok {
match => { "message" => "%{COMBINEDAPACHELOG}" }
}
}
}
Logstash is told there is a filter definition. The if condition makes sure to only apply this filter (specifically the grok) on incoming events which have the "myapp" field and the value of "myapp" matches "nginx" (see the definition in Filebeat's config again).
When the incoming event matches, the defined grok %{COMBINEDAPACHELOG} is applied on the message field. The grok itself is defined in /usr/share/logstash/patterns/nginx:
root@logstash:~# cat /usr/share/logstash/patterns/nginx
HTTPD_COMMONLOG %{IPORHOST:clientip} %{HTTPDUSER:ident} %{HTTPDUSER:auth} \[%{HTTPDATE:timestamp}\] "(?:%{WORD:verb} %{NOTSPACE:request}(?: HTTP/%{NUMBER:httpversion})?|%{DATA:rawrequest})" %{NUMBER:response} (?:%{NUMBER:bytes}|-)
HTTPD_COMBINEDLOG %{HTTPD_COMMONLOG} %{QS:referrer} %{QS:useragent}(?:(%{DATA:tlsversion})?)(?:(%{GREEDYDATA:tlscipher})?)
Finally the resulting data is written into an Elasticsearch Index "nginx":
root@logstash:~$ cat /etc/logstash/conf.d/99-outputs.conf
filter {
if [myapp] == "nginx" {
mutate {
add_field => {
"[@metadata][target_index]" => "nginx"
}
}
}
}
output {
elasticsearch {
hosts => [ "es1.example.com:9200", "es2.example.com:9200", "es3.example.com:9200" ]
index => "%{[@metadata][target_index]}-%{+YYYY.MM.dd}"
ssl_certificate_verification => false
user => "elastic"
password => "secret"
}
}
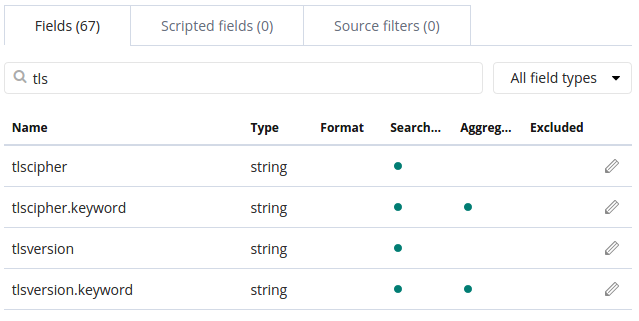
Now that the data lands in Elasticsearch, the data can be viewed in Kibana. As there are two new fields in this index (nginx), Kibana first must refresh the fields of the Index. This can be done in Management -> Kibana Index Patterns -> Select the relevant Index -> Click on the "refresh field list" icon. The new tls fields should show up (in the worst case, wait one day and repeat):
The logs can now be analyzed in Kibana using these new TLS fields. For example to display HTTP requests using an old TLS version, the filters can be set accordingly:
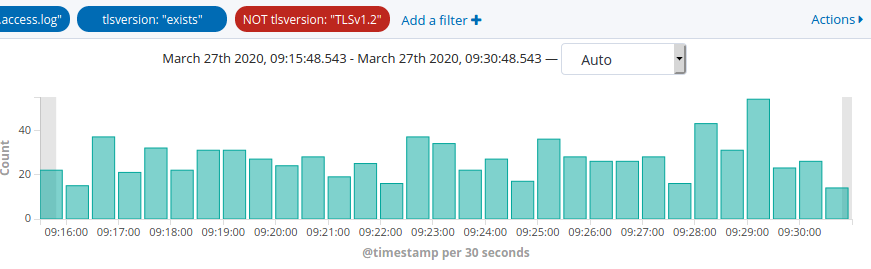
Indeed, there are still requests happening using older TLS versions!
Of course once the data can be analyzed in Kibana, it's almost a must to create graphs out of this data. By looking at the last 24 hours of a highly frequented website, we can see that most requests are using TLS 1.2 (99.19%).
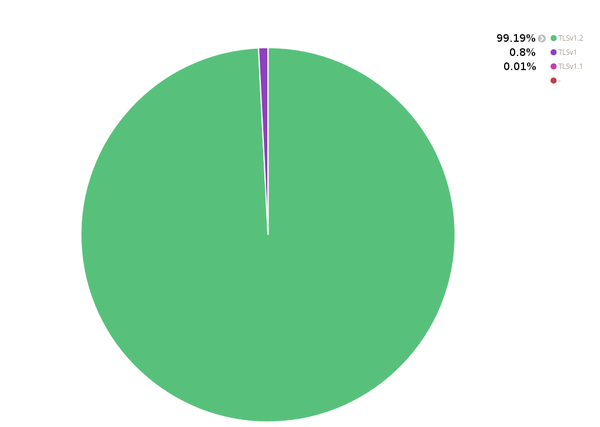
Only a few requests are using TLS 1.1 (0.01%) and TLS 1.0 (0.8%). Interesting however that TLS 1.0 is more widely used than TLS 1.1!
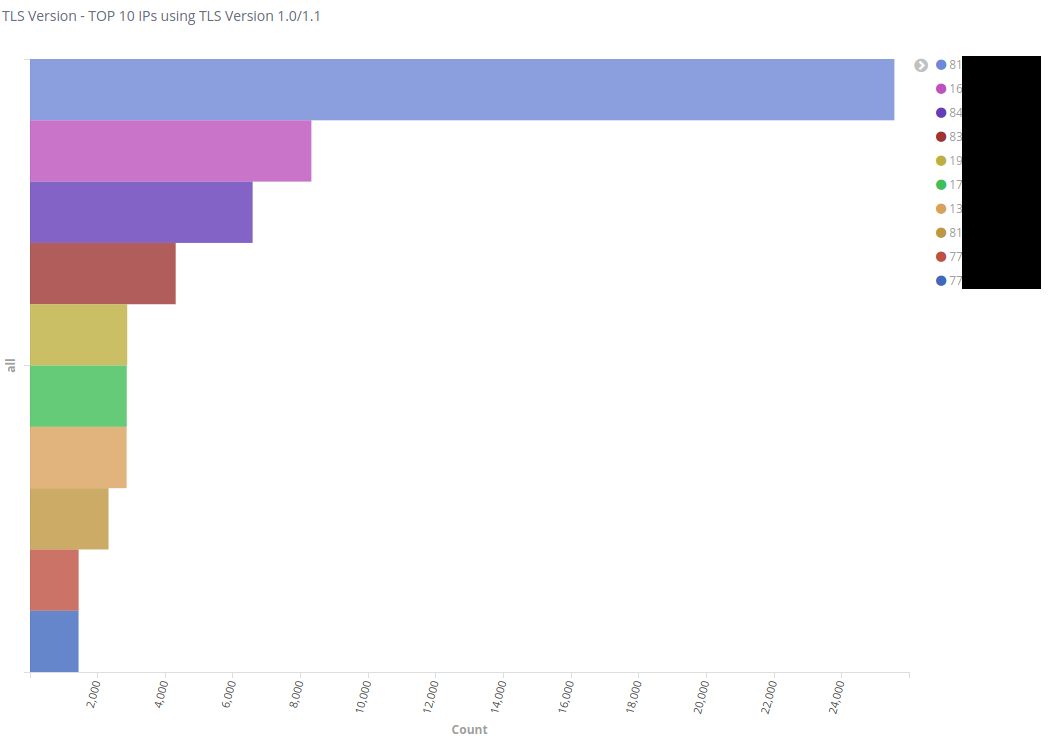
The big question now is: Are these requests using old TLS versions just random HTTP requests from many clients or is a specific client worth to be looked at closer? By splitting the "non TLS 1.2 requests" data into top 10 clients, one client clearly creates the most requests:
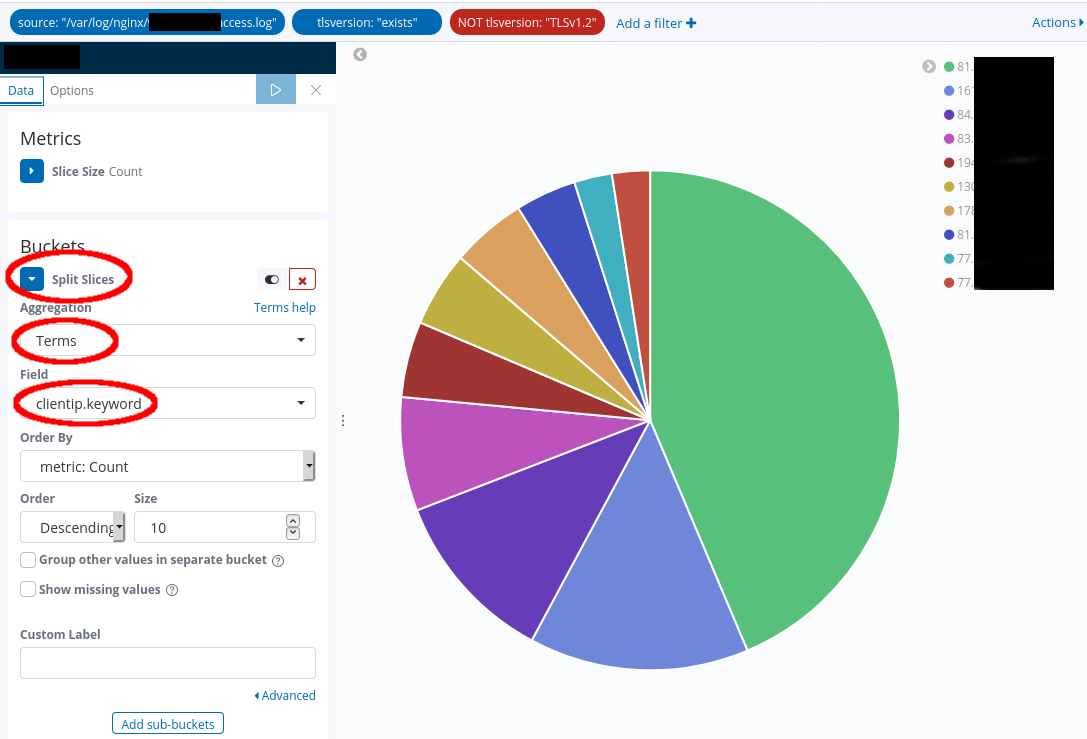
Using a pie chart confirms that out of the top 10 clients, the client starting with IP 81.... is really responsible for most (43.64%) HTTP requests using an old TLS version!
By analyzing this data, one particular client stands out and is worth to be investigated further. It could be an application still running with (old) libraries only capable of using TLS 1.0. Disabling TLS 1.0 without a prior analysis would mean that this particular application would stop working. Therefore: Before adjusting TLS configurations on web servers and proxies, actual traffic should be analyzed first to see what or who might be impacted by the change.
Updated September 30th 2020
In the original article the grok filter was using the field name "agent" for the requesting user-agent:
root@logstash:~# cat /usr/share/logstash/patterns/nginx
HTTPD_COMMONLOG
%{IPORHOST:clientip} %{HTTPDUSER:ident} %{HTTPDUSER:auth}
\[%{HTTPDATE:timestamp}\] "(?:%{WORD:verb} %{NOTSPACE:request}(?:
HTTP/%{NUMBER:httpversion})?|%{DATA:rawrequest})" %{NUMBER:response}
(?:%{NUMBER:bytes}|-)
HTTPD_COMBINEDLOG %{HTTPD_COMMONLOG} %{QS:referrer} %{QS:agent}(?:(%{DATA:tlsversion})?)(?:(%{GREEDYDATA:tlscipher})?)
However this causes a conflict when Filebeat 7 or newer (maybe even starting with Filebeat 6) are used to ship data to Logstash. Filebeat itself sends its own "client metadata" with Filebeat relevant information to Logstash. This information is stored in:
Now in Elasticsearch this causes a conflict with the data type:
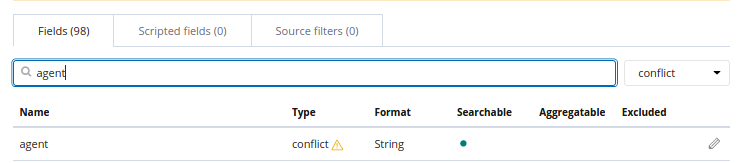
The grok filter was therefore adjusted to call the user-agent field "useragent" instead of "agent":
root@logstash:~# cat /usr/share/logstash/patterns/nginx
HTTPD_COMMONLOG
%{IPORHOST:clientip} %{HTTPDUSER:ident} %{HTTPDUSER:auth}
\[%{HTTPDATE:timestamp}\] "(?:%{WORD:verb} %{NOTSPACE:request}(?:
HTTP/%{NUMBER:httpversion})?|%{DATA:rawrequest})" %{NUMBER:response}
(?:%{NUMBER:bytes}|-)
HTTPD_COMBINEDLOG %{HTTPD_COMMONLOG} %{QS:referrer} %{QS:useragent}(?:(%{DATA:tlsversion})?)(?:(%{GREEDYDATA:tlscipher})?)
The content of the article was adjusted accordingly.