
Of course we cannot always share details about our work with customers, but nevertheless it is nice to show our technical achievements and share some of our implemented solutions.
While handling a disk warning alert, I referred to our monitoring dashboard to see the evolution of the disk usage. By doing this I noticed a difference between the actual disk usage (and capacity) and the graph (panel) in Grafana.
The df command shows a 50GB capacity on the drive, 47GB are currently used:
root@irczsrvc14:~# df -h /
Filesystem Type Size Used Avail Use% Mounted on
/dev/vgdata/irczsrvc14 ext4 50G 47G 3.1G 94% /
Yet the graph in Grafana showed completely different data:
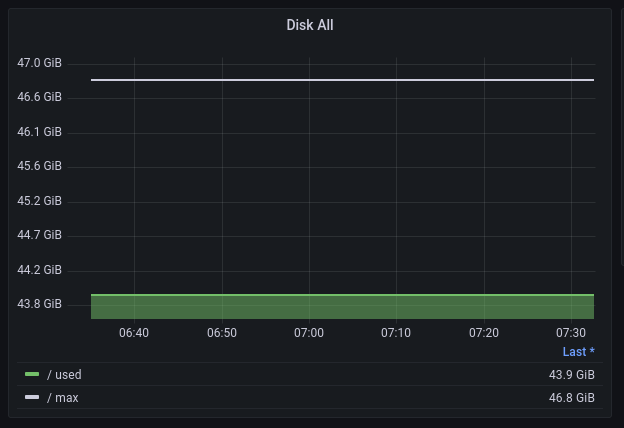
Instead of showing the capacity of ~50 GB, the max value shows 46.8 GB. The usage also differs. Instead of showing the 47 GB used, a different value of 43.9 GB is showing in the graph. The graph is several GB off from the real data.
Ahhh! What does that mean?! Let's follow the chain of data input.
Obviously the data is retrieved by executing the check_disk monitoring plugin on that server. By doing this manually we can see that the plugin's performance data shows the data in MB (by default):
root@irczsrvc14:~# /usr/lib/nagios/plugins/check_disk /
DISK OK - free space: / 3100 MB (6% inode=88%);| /=47151MB;;;0;50268
The performance data (behind the pipe (|) character) follows the Nagios plugin development guidelines and starts with the used value. 47151 MB in GB (/1024) is ~ 46.05 GB. The last bit of the performance data represents the max value, here 50268 MB which in GB (/1024) is ~ 49.09 GB. Interesting we're off already compared to the df -h command.
The Icinga user interface (Icingaweb2) reads the performance data directly from the plugin output and shows it below the check result.
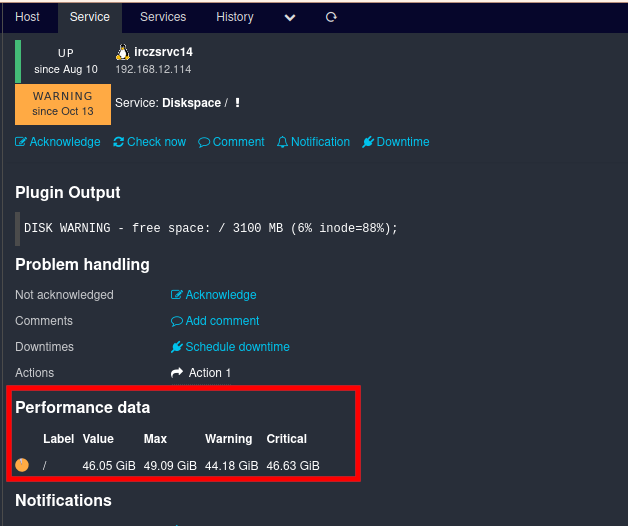
In this situation, Icinga did the same calculation as we just did before (/1024) to obtain the value in GB. Although the percentage - 94% used, 6% free - is correct, the data is wrong (again, compared to the df -h output).
In our setups, we usually use InfluxDB as a time series database behind Icinga. Using Icinga's InfluxDB Writer feature, the performance of each plugin is written into the database. Let's take a look at the last results of check_disk on this particular server:
> SELECT * FROM "nrpe_check_disk" WHERE "hostname" =~ /irczsrvc14/ AND time > '2022-11-02T22:23:00Z';
name: nrpe_check_disk
time crit hostname max metric min service unit value warn
---- ---- -------- --- ------ --- ------- ---- ----- ----
1667458507000000000 47754000000 irczsrvc14 50268000000 / 0 Diskspace / bytes 47151000000 45241000000
Note: the measurement (table) in this case is nrpe_check_disk. We used a special configuration to use a different measurement table for plugins executed remotely via nrpe.
Now something very interesting can be seen here: The data in InfluxDB shows the same values as seen from the check_disk plugin (47151MB used, 50268MB max), however the values were not multiplied with 1024 as one would expect with Bytes, there were multiplied with 1000:
Looking at this data from InfluxDB and comparing with the df output, they look much more similar than the data shown in the Grafana visualization and the performance data shown in Icinga's user interface.
Have we done a mistake in the data representation in Grafana? Does Icinga do the same mistake? But aren't Byte values supposed to always multiply and divide by 1024 to get to the next higher or lower unit? Actually, no.
Behind the Bit and Byte data there's the binary prefix, deciding whether the calculations follow a base value of 1024 (International Electrotechnical Commission, IEC) or 1000 (International System of Units, SI). Although it is common knowledge that Byte usually uses 1024 (IEC) as a base value, there is some confusion:
Starting around 1998, the IEC and several other standards and trade organizations attempted to address the ambiguity by publishing standards and recommendations for a set of binary prefixes that refer exclusively to powers of 1024. Accordingly, the US National Institute of Standards and Technology (NIST) requires that SI prefixes be used only in the decimal sense:[1] kilobyte and megabyte denote one thousand bytes and one million bytes respectively (consistent with SI), while new terms such as kibibyte, mebibyte, and gibibyte, having the symbols KiB, MiB, and GiB, denote 1024 bytes, 1048576 bytes, and 1073741824 bytes, respectively.[2] In 2008, the IEC prefixes were incorporated into the International System of Quantities alongside the decimal prefixes of the international standard system of units (see ISO/IEC 80000).
To show this in a comparison with Bytes:
| Unit |
IEC (1024), Binary |
SI (1000) Decimal |
| single |
1 B |
1 B |
| kilo |
1024 (KiB) |
1000 (kB) |
| mega |
1024^2 (MiB) |
1000^2 (MB) |
| giga |
1024^3 (GiB) |
1000^3 (GB) |
| tera |
1024^4 (TiB) |
1000^4 (TB) |
| peta |
1024^5 (PiB) |
1000^5 (PB) |
With that knowledge in mind, let's take a look at the Grafana graph panel again. By editing the panel, the panel options on the right hand side show up. The data unit option tells Grafana how to calculate and represent the data retrieved from the database.
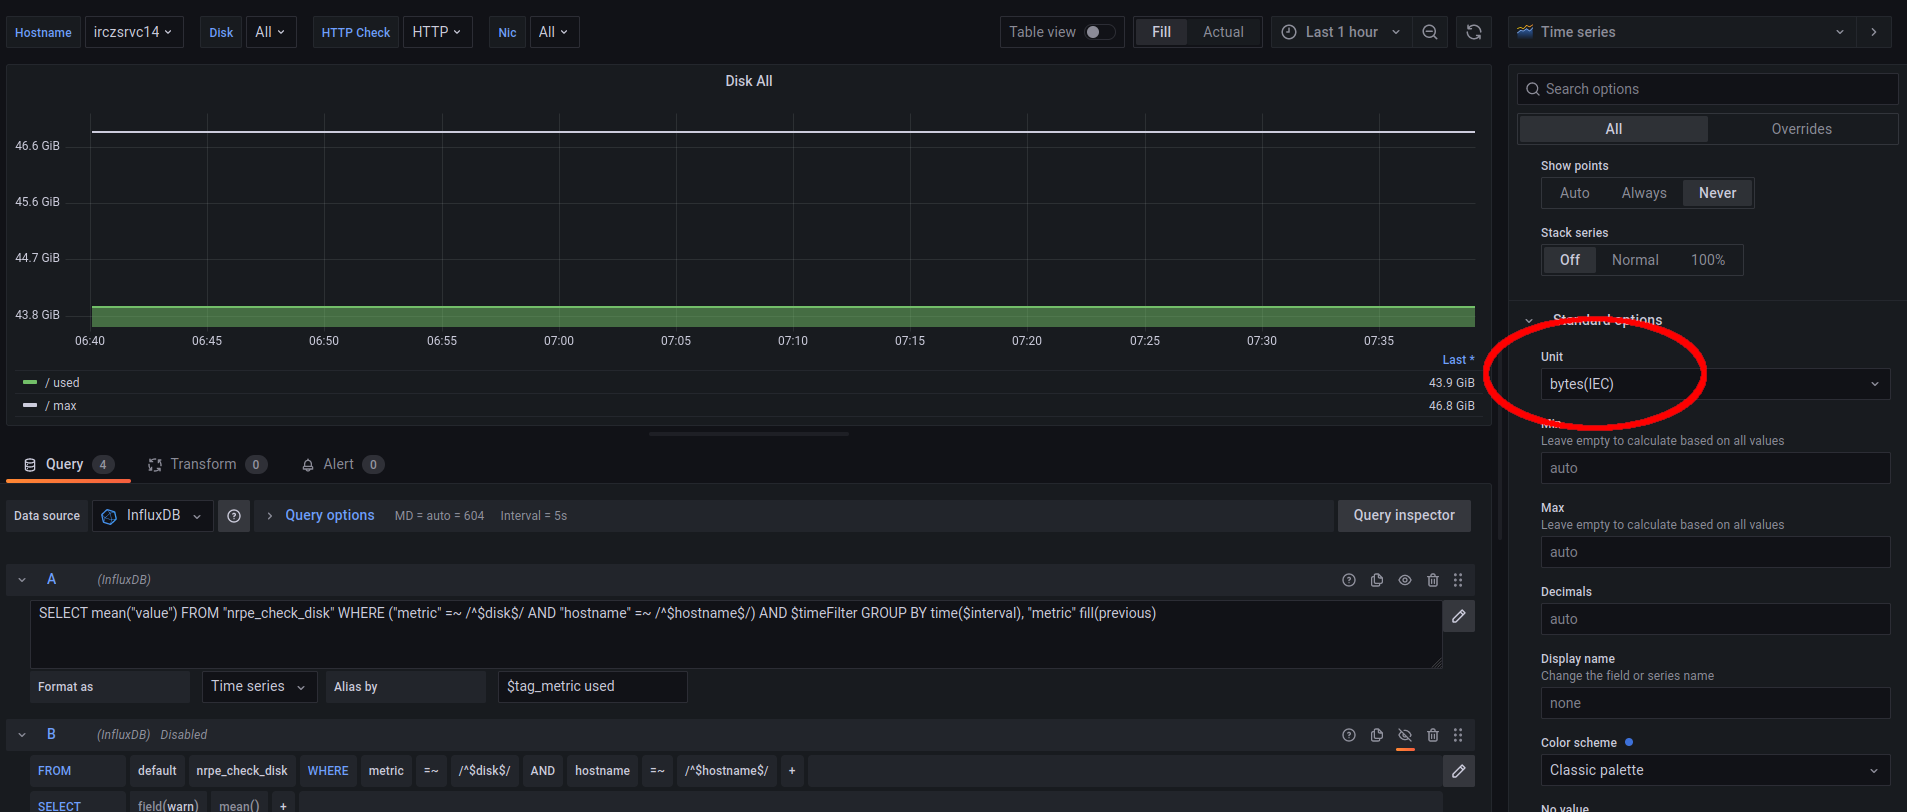
The current setting shows bytes(IEC) is currently used as unit calculation. This tells Grafana to retrieve the value(s) from the database and calculate them using the IEC (1024) method, basically representing GiB (and not GB) in the graph. And Grafana does this correctly, as you can see in the Y axis.
When we change the unit to bytes(SI), how will the graph change?
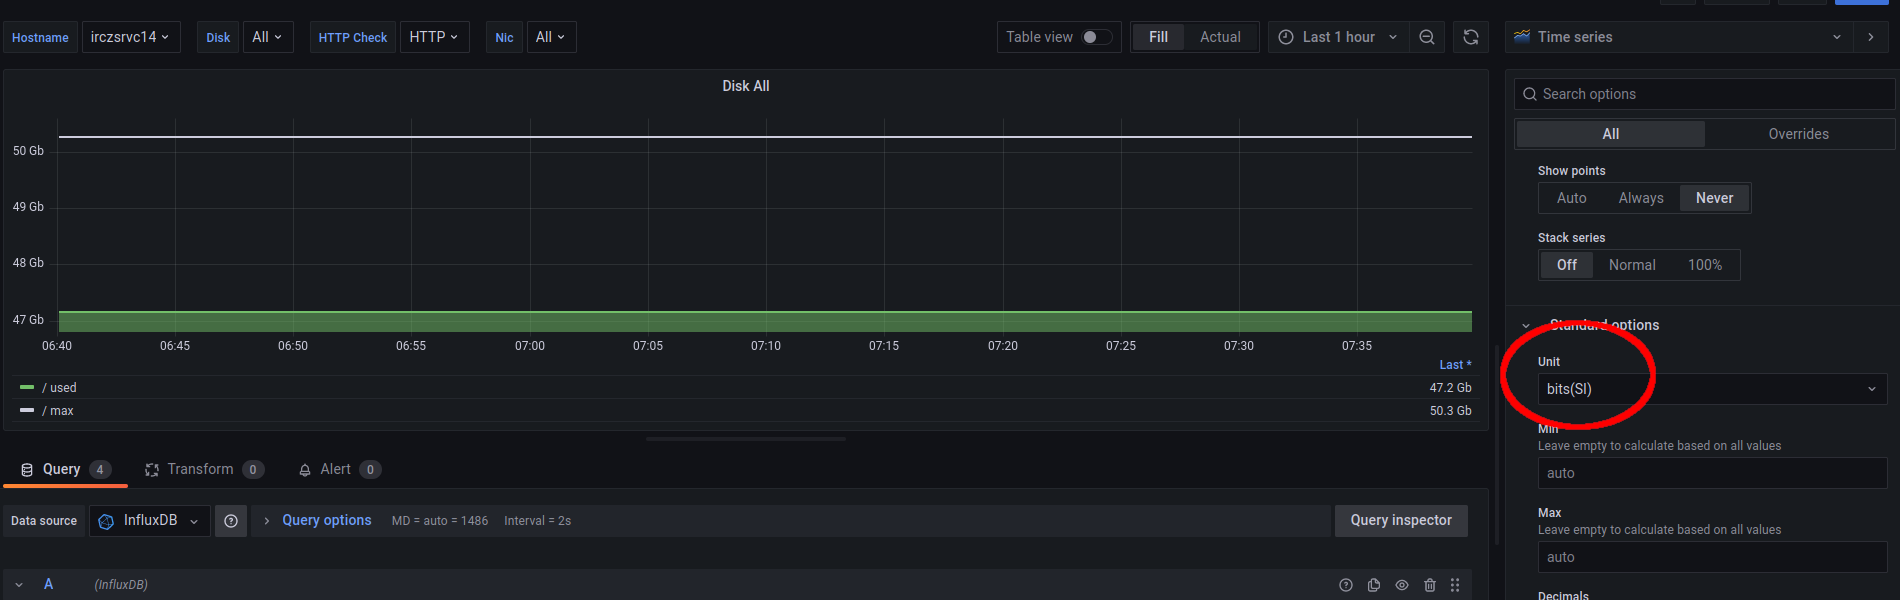
We can see two major changes: The Y axis now shows Gb as value (which would indicate Gigabit, but oh well) but more importantly the used value now shows 47.2 Gb, which finally shows the same value from the df -h command.
Of course there could be endless discussions whether using IEC or SI is right or wrong. At the end it doesn't even matter that much, as long as your input (check) and output (graph) use the same unit calculation.
Even the df command itself can show two different values. Once using IEC:
root@irczsrvc14:~# df -h /
Filesystem Type Size Used Avail Use% Mounted on
/dev/vgdata/irczsrvc14 ext4 50G 47G 3.1G 94% /
Or using SI:
root@irczsrvc14:~# df -H /
Filesystem Type Size Used Avail Use% Mounted on
/dev/vgdata/irczsrvc14 ext4 53G 50G 3.3G 94% /