
Of course we cannot always share details about our work with customers, but nevertheless it is nice to show our technical achievements and share some of our implemented solutions.
Since version 2.2.x, Rancher offers Kubernetes cluster monitoring. The monitoring service can be enabled in the cluster options and runs Prometheus and Grafana in the background. The whole service is deployed within the cluster's cattle-prometheus namespace (which can be found in Rancher's System project).
On each node a Prometheus exporter is running, collecting data of nodes and pods running on each nodes. The data is then sent to the central Prometheus instance (running as prometheus-cluster-monitoring workload) and is visualized in a Grafana dashboard (running as grafana-cluster-monitoring workload).
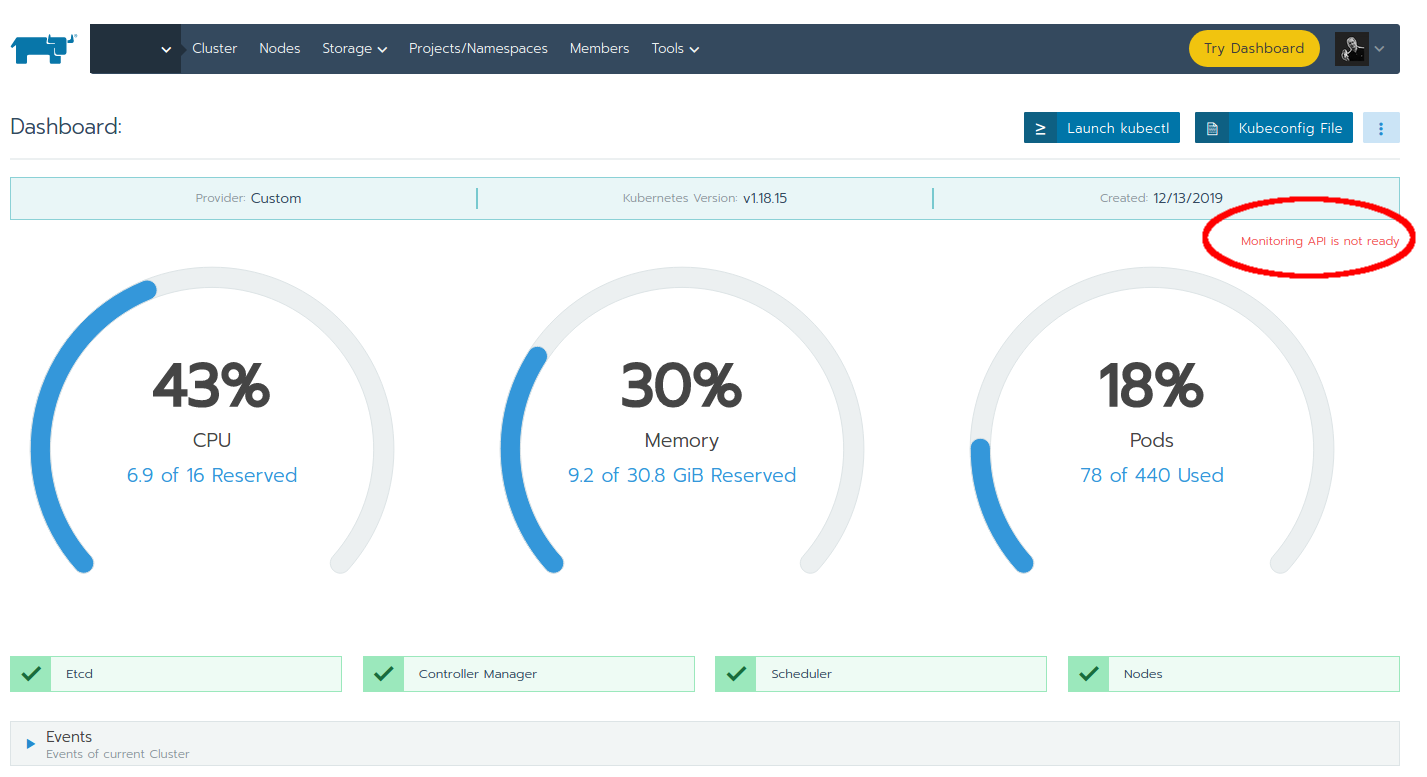
Unfortunately there are several conditions where monitoring in a Rancher managed Kubernetes cluster would stop working. Most of the times the reasons are not clear to the end user, just a text in red font mentioning "Monitoring API is not ready" shows up in the cluster overview.
Here are several reasons why this may happen and how to fix it.
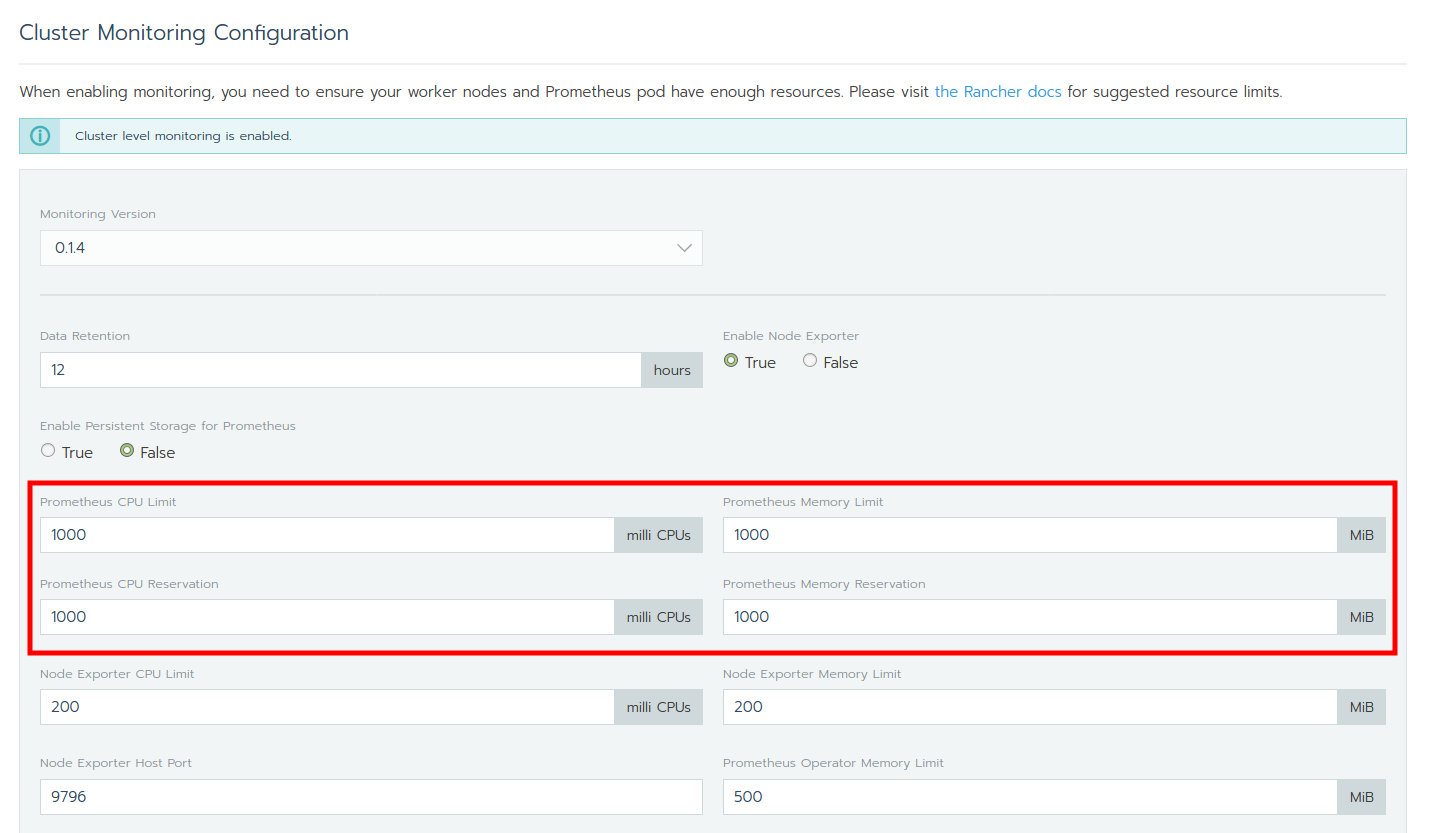
Prometheus may require more resources than what was assigned to it. When enabling the monitoring on the Kubernetes cluster, Rancher uses a default limit of 1000 milli CPU and 1000 MB memory on the Prometheus service. If your Kubernetes cluster is working heavily, Prometheus may quickly run out of available resources and hit the limit. When this happens, the node, on which Prometheus runs, will suffer from heavy CPU usage. And monitoring won't work anymore, of course. However this can be fixed by redeploying the prometheus-cluster-monitoring workload with the new limits.
The fastest way to find out whether the prometheus container has hit the memory limit, use the following commands on the node where Prometheus runs (pod of prometheus-cluster-monitoring workload):
root@k8snode1~# docker stats $(docker ps | grep k8s_prometheus_prometheus-cluster-monitoring | awk '{print $1}') --format "table {{.Container}}\t{{.BlockIO}}\t{{.CPUPerc}}\t{{.MemPerc}}\t{{.MemUsage}}" --no-stream
CONTAINER BLOCK I/O CPU % MEM % MEM USAGE / LIMIT
cf4526a528ed 0B / 119kB 0.07% 63.55% 635.5MiB / 1000MiB
For more details, read our previous blog post Rancher 2 managed Kubernetes cluster node slow due to Prometheus / How to find the reason for a slow node and dynamically adjust resource limits.
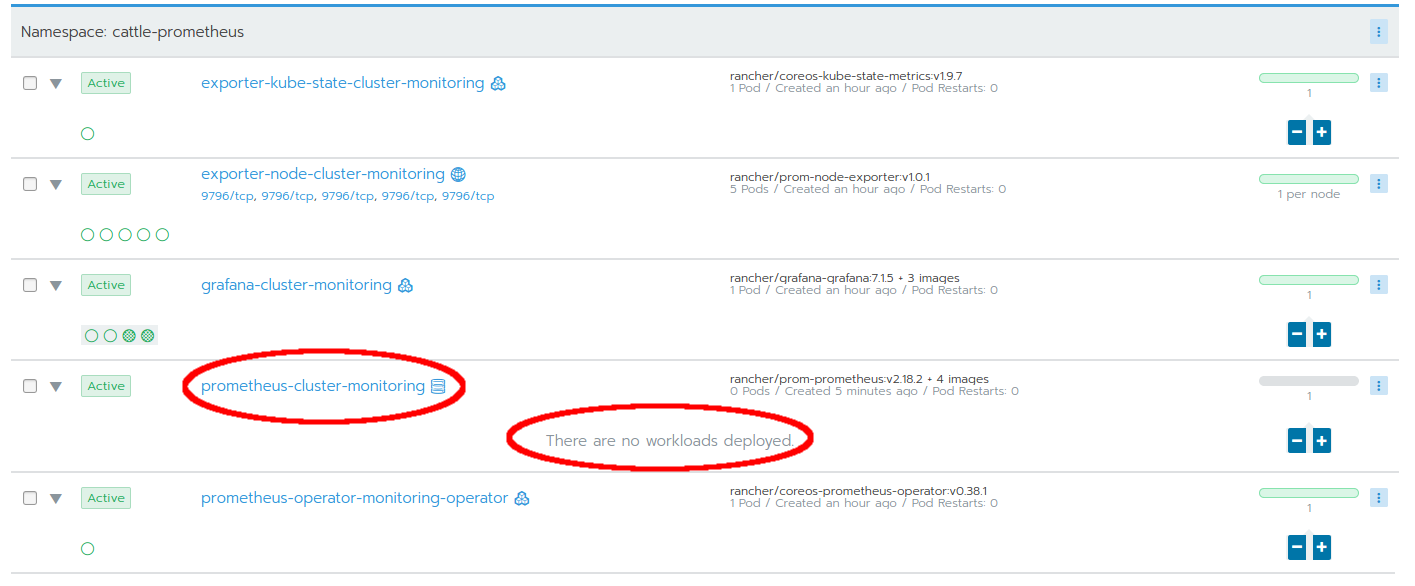
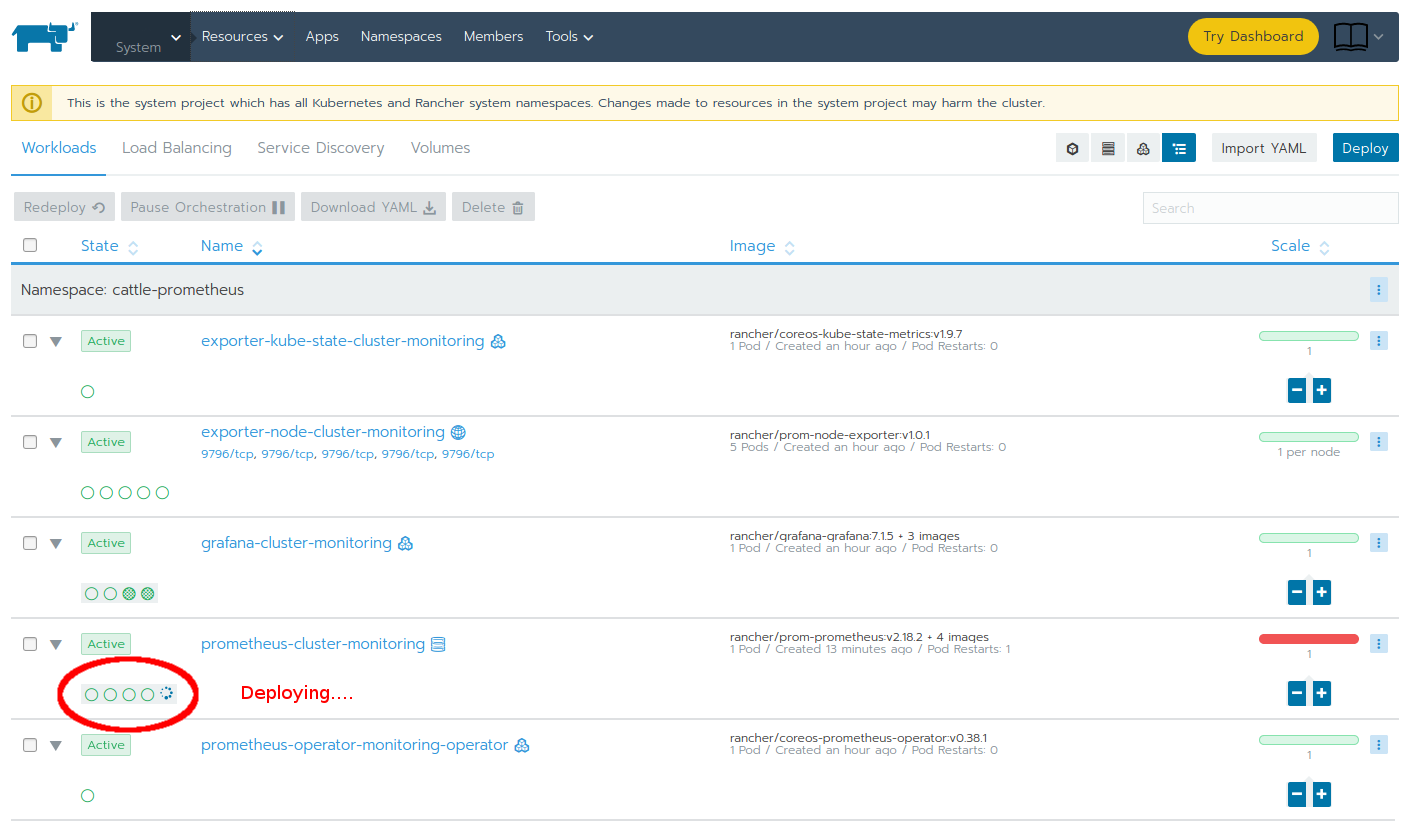
Another hidden problem is when the configuration of limits was deemed "invalid" by the prometheus-cluster-monitoring service. A symptom of this problem is when the prometheus-cluster-monitoring workload refuses to deploy a pod. In Rancher's user interface, this workload remains without any pod:
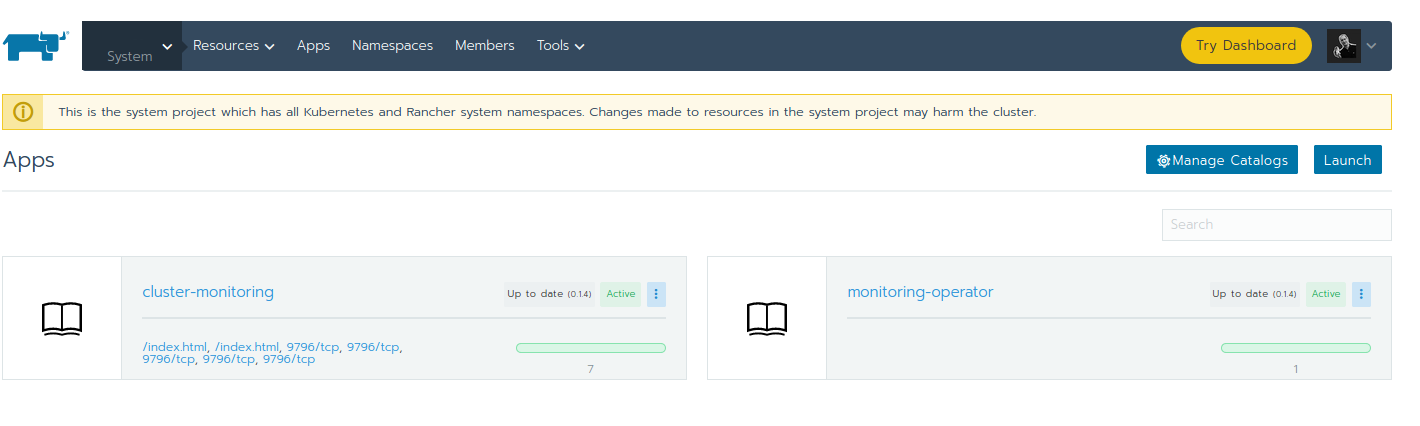
However no information is shown, why this is happening. Even the cluster-monitoring and monitoring-operator apps (they can be seen in Project System -> Apps) appear green and active:
The only way to (properly) find the reason for this behaviour is to use kubectl.
Once kubectl is configured to use this particular Rancher 2 managed Kubernetes cluster (see How to use kubectl on a Rancher 2 managed Kubernetes cluster), detailed information from the prometheus-cluster-monitoring statefulset (that's a Kubernetes service type) within the cattle-prometheus namespace can be retrieved. This command shows a lot of information, including the configuration of
this service. But most importantly, at the end, log events should reveal
the reason for the failed deployment:
$ kubectl describe -n cattle-prometheus statefulset prometheus-cluster-monitoring
[...]
Events:
Type Reason Age From Message
---- ------ ---- ---- -------
Warning FailedCreate 3m24s (x18 over 13m) statefulset-controller create Pod prometheus-cluster-monitoring-0 in StatefulSet prometheus-cluster-monitoring failed error: Pod "prometheus-cluster-monitoring-0" is invalid: spec.containers[0].resources.requests: Invalid value: "750m": must be less than or equal to cpu limit
Warning FailedCreate 97s (x13 over 118s) statefulset-controller create Pod prometheus-cluster-monitoring-0 in StatefulSet prometheus-cluster-monitoring failed error: Pod "prometheus-cluster-monitoring-0" is invalid: spec.containers[0].resources.requests: Invalid value: "750m": must be less than or equal to cpu limit
The relevant error is shown here: Invalid value: "750m": must be less than or equal to cpu limit.
Adjust the values for the limits in cluster overview -> Tools -> Monitoring to 1000 each:
After saving the modification, the prometheus-cluster-monitoring workload should finally be deployed. This can be verified once again with kubectl:
$ kubectl describe -n cattle-prometheus statefulset prometheus-cluster-monitoring
[...]
Events:
Type Reason Age From Message
---- ------ ---- ---- -------
Warning FailedCreate 3m24s (x18 over 13m) statefulset-controller create Pod prometheus-cluster-monitoring-0 in StatefulSet prometheus-cluster-monitoring failed error: Pod "prometheus-cluster-monitoring-0" is invalid: spec.containers[0].resources.requests: Invalid value: "750m": must be less than or equal to cpu limit
Warning FailedCreate 97s (x13 over 118s) statefulset-controller create Pod prometheus-cluster-monitoring-0 in StatefulSet prometheus-cluster-monitoring failed error: Pod "prometheus-cluster-monitoring-0" is invalid: spec.containers[0].resources.requests: Invalid value: "750m": must be less than or equal to cpu limit
Normal SuccessfulCreate 30s statefulset-controller create Pod prometheus-cluster-monitoring-0 in StatefulSet prometheus-cluster-monitoring successful
In the user interface, the workload can be seen deploying in the cattle-prometheus namespace:
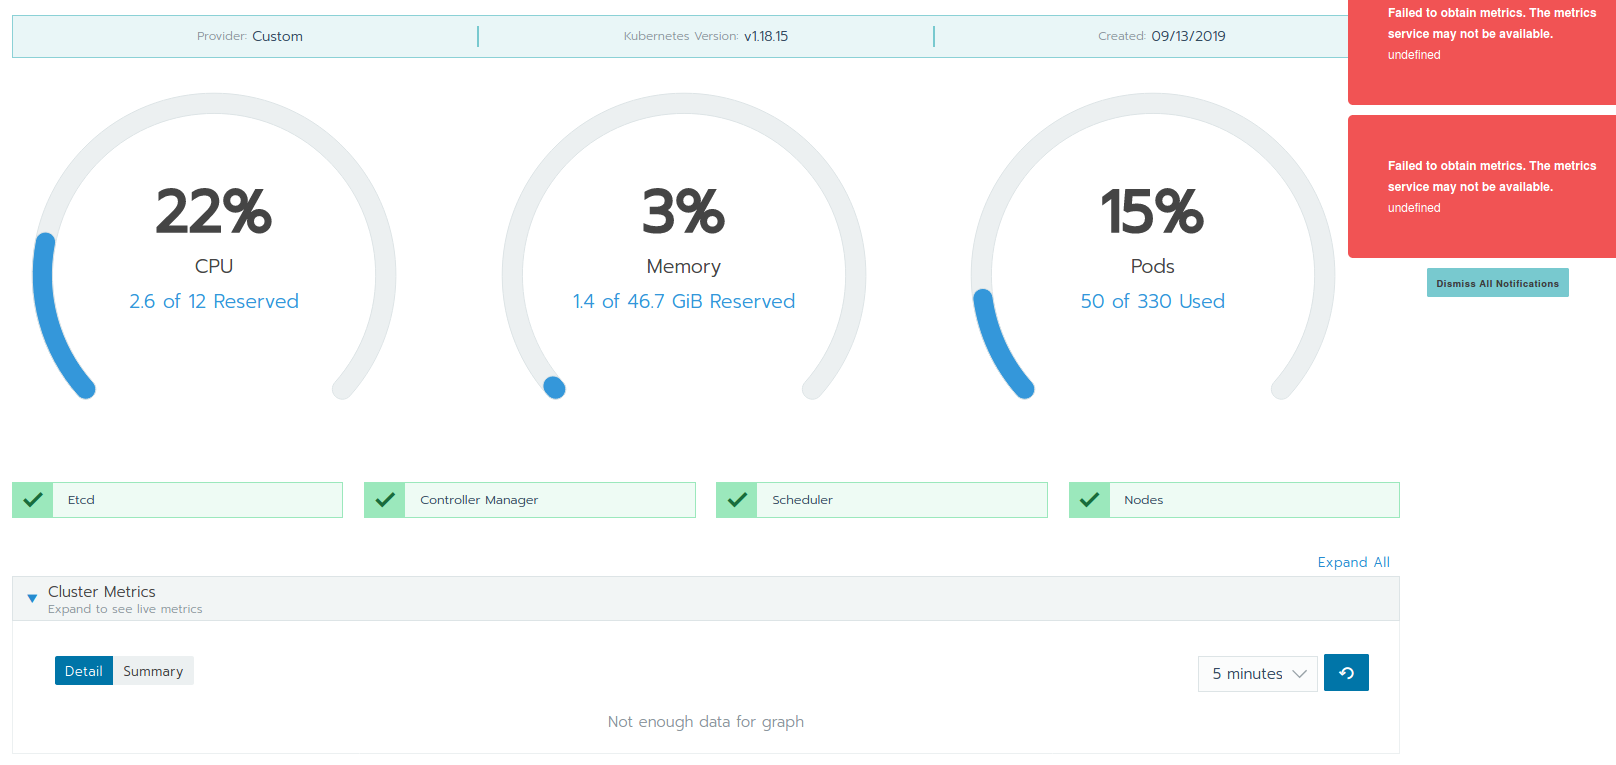
Kubernetes talks a lot. Each cluster node communicates with all other cluster nodes on a lot of ports. Depending on the Kubernetes version, multiple ports can suddenly change or be added. We've already stumbled on additionally required ports in the past and learned from it (see our older blog article Kubernetes upgrade through Rancher gone bad: Lost DNS after upgrading 1.13 to 1.14 for additional information). If the communication between the nodes is blocked (even if it's just one port), this might cause some "hidden damage" in the cluster which might not be obvious. The symptom can be seen as a red notification "Failed to obtain metrics. The metrics service may not be available." in the cluster overview.
Additional information can be found in the logs of the metrics-server workload, in the System project under the kube-system namespace:
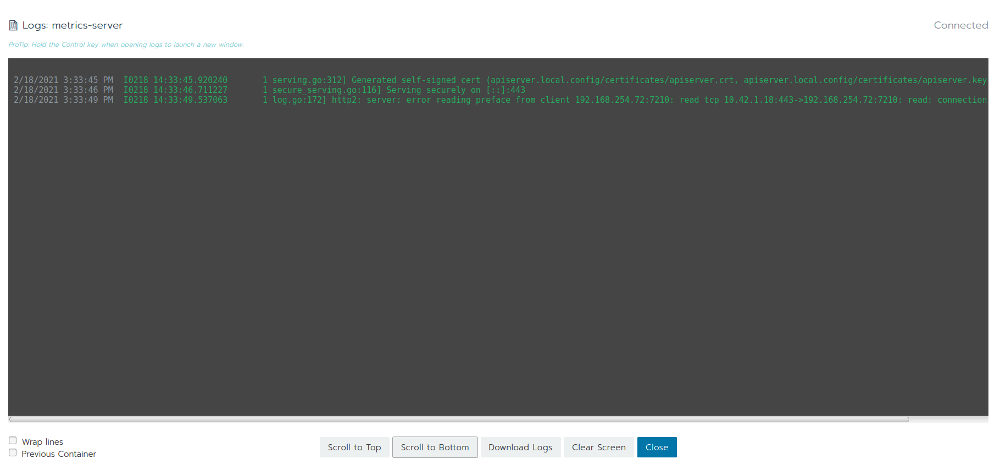
The metrics-server does not log a lot, however whatever line contains the word error is worth to look at. In this case an error mentioning some kind of communication is logged:
http2: server: error reading preface from client 192.168.254.72:7210: read tcp 10.42.1.18:443->192.168.254.72:7210: read: connection reset by peer
Unfortunately there is not more information given of what could be the cause. However a look into the firewall logs may reveal more:
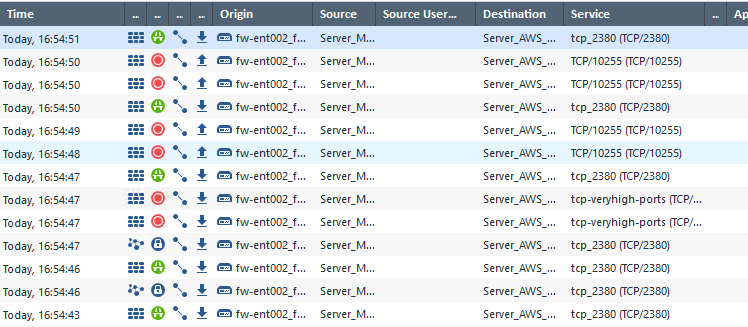
In this case a high port (tcp/10255) was blocked by the firewall. This happened from two local cluster nodes towards a third cluster node in the AWS cloud.
Once this port was added to the group of allowed "Kubernetes ports", no blocked communication could be seen in the logs anymore.
After this firewall change, all the workloads in cattle-prometheus namespace and the metrics-server in kube-system namespace were redeployed.
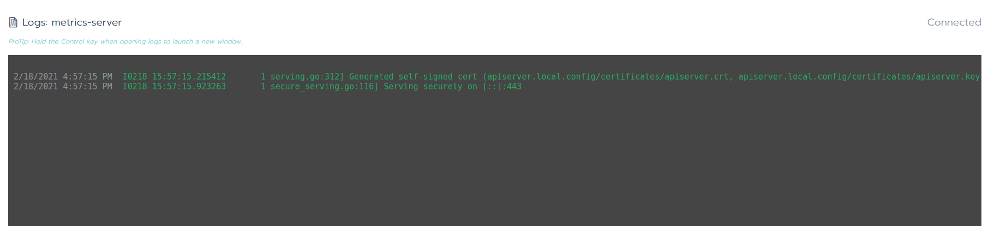
Now the logs from the metrics-server did not contain the error anymore:
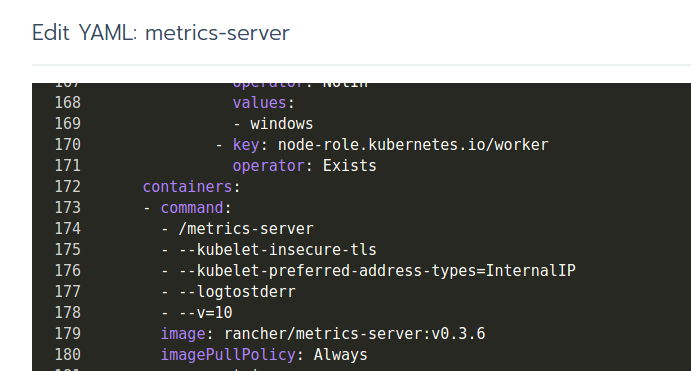
Most likely the metrics-server itself is not the problem, but it can never be ruled out either. To debug metrics-server (running in the kube-system namespace), it can be redeployed by adding high verbosity logging. Click on the metrics-server workload and then use the "three button menu" to select "View/Edit YAML".
Scroll down until you find the the command line parameters how metrics server should be started. Append a line with: - --v=10. This will enable a very verbose logging.
The logs can then be seen in the Rancher UI or using kubectl with the new metrics-server name:
$ kubectl get pods -n kube-system
NAME READY STATUS RESTARTS AGE
canal-7q7b8 2/2 Running 0 16h
canal-fh5d9 2/2 Running 0 16h
canal-h9qrw 2/2 Running 0 16h
canal-tsctp 2/2 Running 0 16h
coredns-7cdfd764b4-ggrbv 1/1 Running 0 41h
coredns-autoscaler-7768d884b9-9628j 1/1 Running 1 41h
metrics-server-85dd85b84d-glljg 1/1 Running 0 4m10s
rke-coredns-addon-deploy-job-x2ddp 0/1 Completed 0 41h
rke-ingress-controller-deploy-job-sp62h 0/1 Completed 0 41h
rke-metrics-addon-deploy-job-jcp5f 0/1 Completed 0 34m
rke-network-plugin-deploy-job-8l545 0/1 Completed 0 41h
$ kubectl logs metrics-server-85dd85b84d-glljg -n kube-system --tail 1 --follow